Blog
July 29, 2025
Load Testing Explained: What It Is and How to Do It

Performance Testing,
Test Automation
Picture this: You and your team have spent considerable amounts of time and energy throughout the development of your application. You ensured that the proper boxes were checked, and the app’s design and functionality are working as intended.
Yet as the date of release approaches, there is one crucial step remaining in the development process — load testing.
This method of performance testing is vital for understanding the durability of your app so that when it gets in the hands of your users, you can rest assured that it will offer a seamless UX without glitches or crashes.
In this blog, we will discuss what load testing is, why load testing is important, how to incorporate load testing into your testing strategy, and load testing best practices.
What is Load Testing?
Load testing simulates a “load” or significant usage of an application to determine whether it can remain stable during use. By monitoring extended response times or unstable UX, load testing can indicate when your app has reached its maximum operating capacity.
A load test enables testing teams to measure throughput rates, response times, and the utilization levels of resources. It also identifies an application’s breaking point — when it can no longer handle additional traffic. Load testing can pinpoint where in the system there is lag, page load issues, or anything else that might deliver an unstable UX when multiple users access the app or inundate it with sudden traffic.
Why Load Testing is Important
Businesses and organizations depend greatly on their digital presence in the hands of their customers. For industries like banking and retail, it can be a make-or-break situation; a faulty app is one of the easiest ways to lose customers.
According to a study, the average cost of downtime in the IT industry is roughly $9,000 per minute.
That is why it is important to validate an app’s performance under realistic scenarios using load testing. Even if an application can pass a functional test, it does not mean that it can perform the same way under significant load or traffic. Finding the point when and where the app breaks enables teams to fix the issue or issues before production.
The primary objective of using load testing tools is to reduce risk throughout the development cycle. That risk can come in multiple forms:
Software functionality
End-user experience
Company bottom line
How Streaming Service Organizations Prepare for Success With BlazeMeter
See how load testing is put into practical use. Download this eBook to learn how top video streaming services partnered with BlazeMeter to ensure they did not miss a beat when met with massive amounts of traffic.
How to Get Started With Load Testing
Historically, load testing could require a large amount of time and skill to properly set up and run — depending on the tool you used. Luckily, load testing can be implemented relatively easily within your testing strategy thanks to easy-to-use performance testing tools like BlazeMeter. Below are four simple steps for outlining a load test from beginning to end:
Identify Requirements — Determine the most vital functionalities of your application that need load testing. Is it the login screen? Is it the geolocation function of an ATM finder? Establish what will shape the end-user experience.
Illustrate User Journeys — Understanding how your users will engage with your application is everything. This understanding will begin to paint the picture of when and where potential breaking points could occur. Use this stage to tap into your API monitoring for more detailed information.
Form a Baseline — A predetermined baseline lets you know what you are comparing your load tests against. This baseline should be considered your app’s “resting heartrate” — any test result that deviates from your baseline will tell you where there is an issue that needs to be addressed.
Rinse, Repeat, & Automate — Once you have established a successful load testing setup, now you can prioritize it within your broader strategy. The best part? You can easily automate load tests within BlazeMeter.
How to Do Load Testing From Beginning to End
1. Design a Performance Testing Plan
After we define which environment will be tested and which tools will be used to develop the scripts and execute them, it’s time to design and define the test plan. This planning document should contain:
- Introduction: A brief overview
- Objective: What is the objective of these load tests and the benefits they will bring
- Scope: The system processes that are going to be tested
- Architecture: Details of the application architecture, like Application Server, Web Server, DB Server, Firewalls, 3rd party applications, etc.
- Prerequisites: All the resources required to start the project, like ensuring all the components that will be load tested are functionally and stable and that the environment is the same as the one that is in production and has (at least) similar data to production
- Test Scenarios: The list of scenarios that are going to be tested
- Load Execution Cycles: Mention the baseline, how many cycles of test runs will be executed, the duration of each cycle and its load
- Team: The team members who will be involved in the scripting and execution of the load tests
2. Create Test Cases
The goal of test cases is to establish the level of performance delivered by the present system. The information gathered is helpful for benchmarking in future. It is recommended that performance test cases cover the critical functionalities of the application. When I say critical, I mean the most used by users. For example, in e-commerce, one critical functionality is the purchase button.
Here are some important factors that should be given adequate consideration when designing your test cases:
- Expected load: The load expected by the application in production
- Assertions: Ensure that the application responds as we expect for each request
- Security: Ensure that the system maintains user confidentiality, data integrity, and authorized permissions.
- Desired Response Time: The total time it takes for a response to be received after initiating a request for it
3. Create Load Scenarios
In load tests, we simulate the workload that an application will have in production. We count the number of concurrent users accessing the application, the test cases that will be executed, and the frequency of executions by users, among other things.
To design a load scenario it’s recommended to consider these variables:
- Daily operations
- Peak hours on the system
- Most popular days used
With these variables you will be able to identify the most used operation/s and the amount of users that are using those operations. So now that you have the necessary information it’s time to create the load scenario in JMeter.
When preparing a performance test, design a load scenario that uses simplifications of the real system usage, in order to improve the cost/benefit ratio. If we were to create an identical simulation to what the system will receive in production, we would end up with such an expensive test that it would not be worth it. The benefits may not be worth the costs and the results may even be obtained after it’s too late!
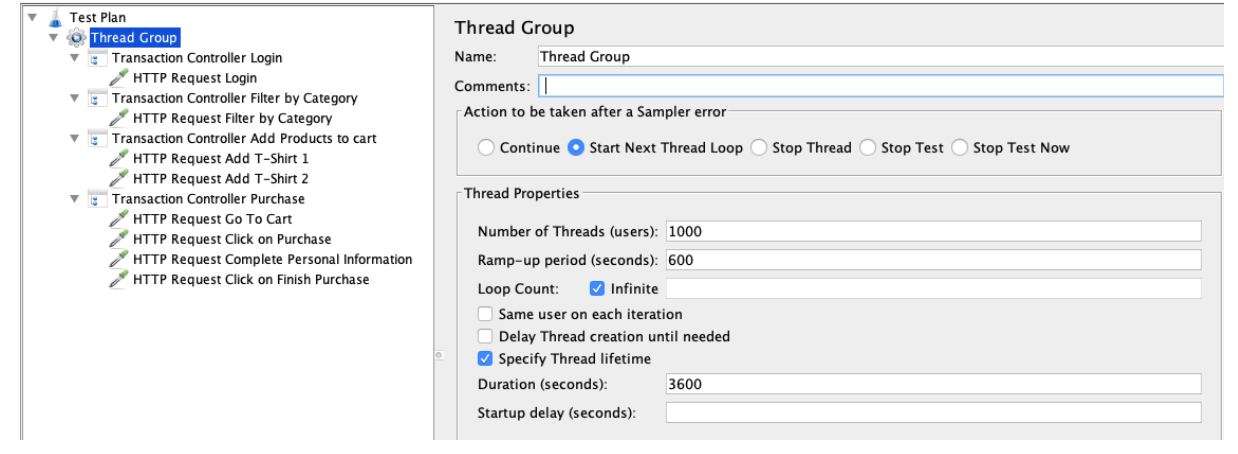
Picture 1 - Tool: JMeter. Load Scenario: Complete workload of a purchase. Number of concurrent users: 1000. Ramp-up: 10 minutes. Execution duration: 1 hour.
4. Identify Infrastructure and Data
It’s highly recommended to know which infrastructure hosts your app and which components are included in the solution. This is useful for understanding the infrastructure and which components need to be monitored during the execution of the tests to gather the necessary information.
To create a more realistic test, data plays an important role in the execution of the tests. So it is recommended that the data amount and data quality/reliability on the testing environment is similar to the one that is in production. This will help simulate “reality” during the test execution.
Let’s see an example. We have two environments with the same infrastructure. The test environment has a database with a small amount of data and the production environment has a database with a lot of data. We send the same request from the front-end. Which response time will be higher? The answer is - the request sent from production. This is because the database that is in production needs more time to process between all the data that contains. As a result, the test is unreliable for real-time usage.
5. Use Acceptance Criteria
Acceptance criteria are the conditions that the test load results must meet to be accepted. Well-written acceptance criteria help avoid unexpected results in production environments and ensure that all stakeholders and users are satisfied with what they get.
Such criteria should be established prior to test runs and are based on what results we expect and require from the application. Some of the most common and important criteria are:
- Response Time
- Error Percentage
- Processor Usage
- Memory Usage
- Disk Usage
6. Execute Tests
During test execution there are some activities that the tester should perform, mainly monitoring the live results and checking engine health. These activities are a crucial component of the test execution phase, essential for the success of the test execution.
You can monitor the results in BlazeMeter.
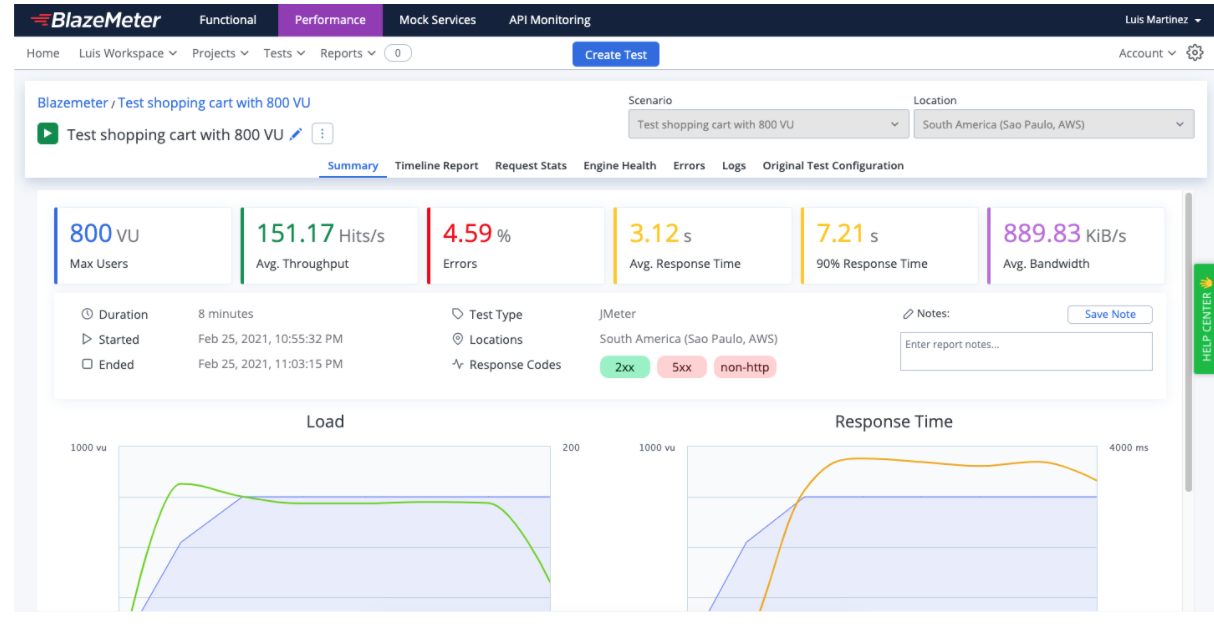
Picture 2 - BlazeMeter summary report of an execution of load test with 800 concurrent virtual users.
It is also recommended to check the Engine health of the engines assigned to the test. This can be done in the “Engine Health” tab (check picture 3). The values of the CPU shouldn’t go over 75% and the memory RAM values 70%. If the values are higher you should consider decreasing the number of virtual users per engine or check the script to make it more efficient. For example, if you have a Beanshell postprocessor you could exchange it with a JSR223 postprocessor, which allows using Groovy language, so the script will be more efficient when running it.
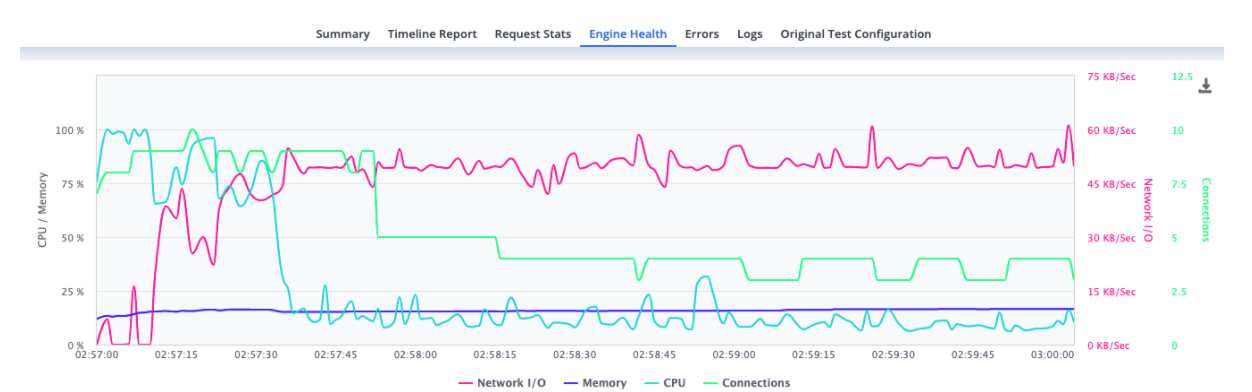
Picture 3 - BlazeMeter Engines Health of an execution of load test with 800 concurrent virtual users.
Load Testing Considerations
Now that you have a basic understanding of what load testing is and how to outline a load test within your testing strategy, here are a few key load testing best practices to keep in mind to get the most out of your efforts.
Test Early & Often
A one-and-done approach to load testing simply will not cut it. To ensure your app can withstand anything that real-word scenarios will throw at it, you must frequently conduct load tests. This will result in increased feedback throughout development that will help you fix issues as they arise.
Use Real-Word Data
You cannot hope to test against real-word scenarios without using real-world data. Use the data you have already collected from your app —user-driven information such as web browsers, devices, drop off points, and user pathways. Doing so will tailor your load tests to suit your app’s unique needs and make them more effective.
Make Realistic Scenarios
Put yourself in the mind of your users. Knowing what is important to them will inform how you your load tests are set up. Realistic load tests help you better understand how your app will function in the hands of the user. Use varying combinations of browsers and devices in your scenarios for broader test coverage.
Set Realistic Benchmarks
Your load test should not start from zero — that is not a reflection of real-word scenarios. Realistically, your app will be under be under some degree of load before a sudden increase of traffic occurs. So, set your benchmarks to your app’s “cruising speed” and apply load from there. This will prevent you from getting false-positive test results.
Analyze, Analyze, Analyze
Once your load tests are complete, take a step back and look at the results. Identify any issues or problem areas and adjust accordingly. This is also where the load testing tool you choose can play a direct role in the efficacy of your results. Do you have to spend significant time translating them? BlazeMeter’s advanced reporting capabilities simplifies your test results with interactive graphs and multiple comparison reports.
Bottom Line
Your application is a direct reflection of your organization. Do you want it to glitch or break in the hands of your customers?
By incorporating load testing into your testing strategy — and load testing often — you can fortify your app for real-world scenarios when it may come under sudden and significant traffic. You will be able to identify when your system is “maxed out” during the development process and smooth those wrinkles prior to release.
BlazeMeter’s load testing capabilities are the industry leader for a reason. No other tool on the market can match its ease-of-use, accuracy, ability to scale, and seamless integration with the tools you already use. Ready to get started? Start load testing with BlazeMeter for FREE today!