eBook > The JMeter Playbook: Build, Scale, and Optimize Performance Tests
Listeners
When JMeter runs a Sampler, the Sampler produces a Sample Result containing metrics like:
- timestamp
- response time
- connect time
- time-to-first-byte or latency
- number of sent and received bytes
- response code and message
Listeners capture the results produced by samplers and present them in various formats (tables, graphs, trees, or files). They are how you see what happened during a test.
Back to topAdding a Listener
Right-click the Thread Group (or Test Plan) → Add → Listener → [choose one].
Back to topEssential Listeners
View Results Tree
The most useful listener for test creation and/or debugging. It shows every request and response in full detail:
- Request headers and body
- Response headers, body, and status code
- Latency, connect time, and response size

📸 Screenshot: View Results Tree showing a successful GET request.
Warning: View Results Tree stores entire response body in memory. For each user
Never leave it enabled during a real load test - it will causeOutOfMemoryError.
Summary Report
A compact table that shows aggregate statistics per sampler label (name):
| Column | Meaning |
|---|---|
| # Samples | Total requests sent |
| Average | Mean response time (ms) |
| Min / Max | Fastest and slowest response |
| Std. Dev. | Standard deviation of response time |
| Error % | Percentage of failed requests |
| Throughput | Requests per second (or per minute) |
| KB/sec | Network throughput |
You can use it for taking a quick glance into the test results. It doesn’t tell you the full story, but you will get overall response times and percentage of errors.
Aggregate Report
Similar to Summary Report but adds median (50% Line), 90% Line, 95% Line and 99% Line columns. These percentiles are critical for SLA verification. For example:
“99% of requests must complete in under 2 seconds.”
means that you need to look at the 99th percentile value.
Backend Listener
Sends results in real time to an external system such as InfluxDB + Grafana. This is the recommended approach for getting test results in real time while your test is running. Also, InfluxDB can be used for storing historical results data; you can even create a dashboard which will compare different test runs results.
Back to topWriting Results to a File
Every listener can write results to a .jtl file (a CSV or XML log). In the Filename field at the top of any listener, enter a path:
results/test-result.jtl
It’s also possible to choose what to store and when to store. For example, you might want to save response data for failed requests only to reduce disk IO.
For CLI mode, you specify the output file with the -l flag:
jmeter -n -t test-plan.jmx -l results/test-result.jtl
CSV vs. XML Format
| Format | Pros | Cons |
|---|---|---|
| CSV (default) | Small file size, fast to parse | No response body data |
| XML | Full request/response data, sub-results | Large files, slower, high disk IO can impact load test |
Control the format in user.properties:
jmeter.save.saveservice.output_format=csv
Listener Best Practices
- Use listeners only for debugging in GUI mode or analyzing test results after test finishes. Delete (or at least disable) them prior to starting your test.
- In CLI mode, rely on the
-lflag to write a.jtlfile, then analyze it after the test. - Use the Aggregate Report over Summary Report because it provides percentiles data.
- Use Backend Listener for real-time monitoring of long tests.
Try It Yourself
- Add a View Results Tree and a Summary Report to your Thread Group.
- Run the test plan from the previous section (with 1 thread, and 1 loop).
- Click on View Results Tree - expand the sampler entries and inspect the request and response tabs.
- Click on Summary Report - note the average response time and throughput.
Test Plan
└── Thread Group  (2 threads, 2 loops)
    ├── HTTP Request Defaults   (protocol: https, server: demoblaze.com)
    ├── HTTP Cookie Manager
    ├── HTTP Cache Manager
    ├── GET /                   (HTTP Request sampler - open homepage)
    ├── GET /entries            (HTTP Request sampler - list products, server: api.demoblaze.com)
    ├── GET /prod.html?idp_=1   (HTTP Request sampler - product details)
    ├── POST /addtocart         (HTTP Request sampler - add to cart, server: api.demoblaze.com)
    │   └── HTTP Header Manager (Content-Type: application/json)
    ├── View Results Tree       ← for debugging
    └── Summary Report          ← for quick stats
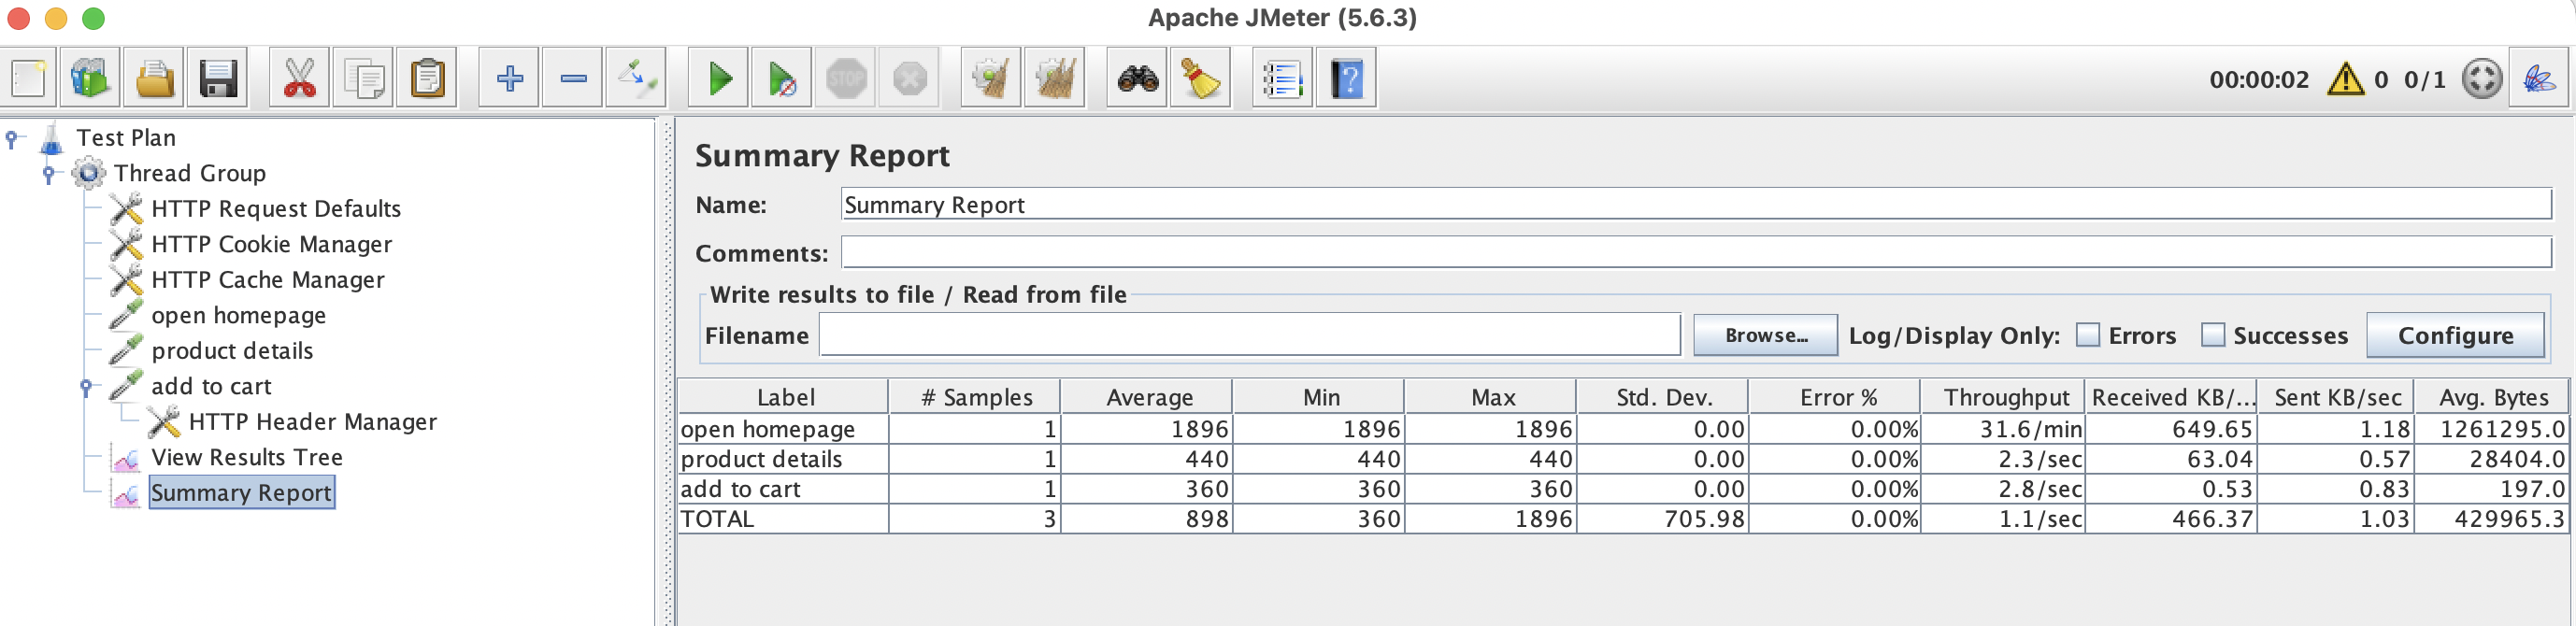
📸 Screenshot: Summary Report Showing Aggregate Information for all 3 requests.
Summary
- View Results Tree - detailed per-request debugging (disable during load tests).
- Summary Report / Aggregate Report - aggregate statistics with throughput and percentiles.
- Backend Listener - real-time streaming to InfluxDB/Grafana.
- Always store results into a
.jtlfile in non-GUI mode for test results analysis when the test is complete.
Now let’s proceed to Parameterization and Correlation.