eBook > The JMeter Playbook: Build, Scale, and Optimize Performance Tests
HTML Dashboard & Sharing Results
JMeter includes powerful and flexible HTML Reporting Dashboard generator that creates full interactive report with charts, tables, and statistics from the JMeter .jtl test results file. This is the easiest way to share performance test results with stakeholders and developers.
Generating the Dashboard
Option 1: Generate During the Test Run
Add the -e and -o flags to your CLI command:
jmeter -n -t test-plan.jmx -f -l results.jtl -e -o report-output/
Note: The command above uses
-fargument which means that test results file and dashboard output folder will be deleted.
Option 2: Generate from an Existing .jtl File
If you already have a .jtl file:
jmeter -g results.jtl -o report-output/
| Flag | Meaning |
|---|---|
-g | Path to the .jtl file (generate report only, no test execution) |
-o | Output directory for the HTML report |
Contents of the HTML Reporting Dashboard
Open report-output/index.html in any browser. The dashboard includes:
Statistics Table
| Metric | Description |
|---|---|
| # Samples | Total requests |
| FAIL | Failed requests |
| Error % | Failure rate |
| Average / Min / Max | Response time statistics |
| Median /90th / 95th / 99th Percentile | Response Times distribution |
| Throughput | Transactions/Requests per second |
| Network KB/sec | Bandwidth usage for sent and received bytes |
Charts
The dashboard generates several interactive charts:
Over Time
- Response Times Over Time - shows how average response times evolve as load increases.
- Response Times Percentiles Over Time - tracks percentile values (p50, p90, p95, p99) over the duration of the test.
- Active Threads Over Time - the number of virtual users at each point of time.
- Bytes Throughput Over Time - the amount of sent and received data.
- Latencies Over Time - time to first byte (TTFB) for each transaction over time.
- Connect Time Over Time - TCP connection establishment time over time; useful for spotting network or server-side connection issues.
Throughput
- Hits Per Second - number of requests sent per second.
- Codes Per Second - response status codes (200, 404, 500, etc.) received per second; helps identify when errors start appearing.
- Transactions Per Second - successful and failed transactions per second.
- Total Transactions Per Second - aggregate transaction rate across all samplers.
- Response Time Vs Request - median response time plotted against global number of requests per second.
Response Times
- Latency Vs Request - latency (TTFB) plotted against the global number of requests per second.
- Response Time Percentiles - distribution of response times (p50, p90, p95, p99) across the entire test.
- Response Time Overview - bar-chart-style breakdown of requests by response time ranges.
- Time Vs Threads - shows how response time changes as the number of active threads increases.
- Response Time Distribution - histogram of response times showing how many requests fell into each time bucket.
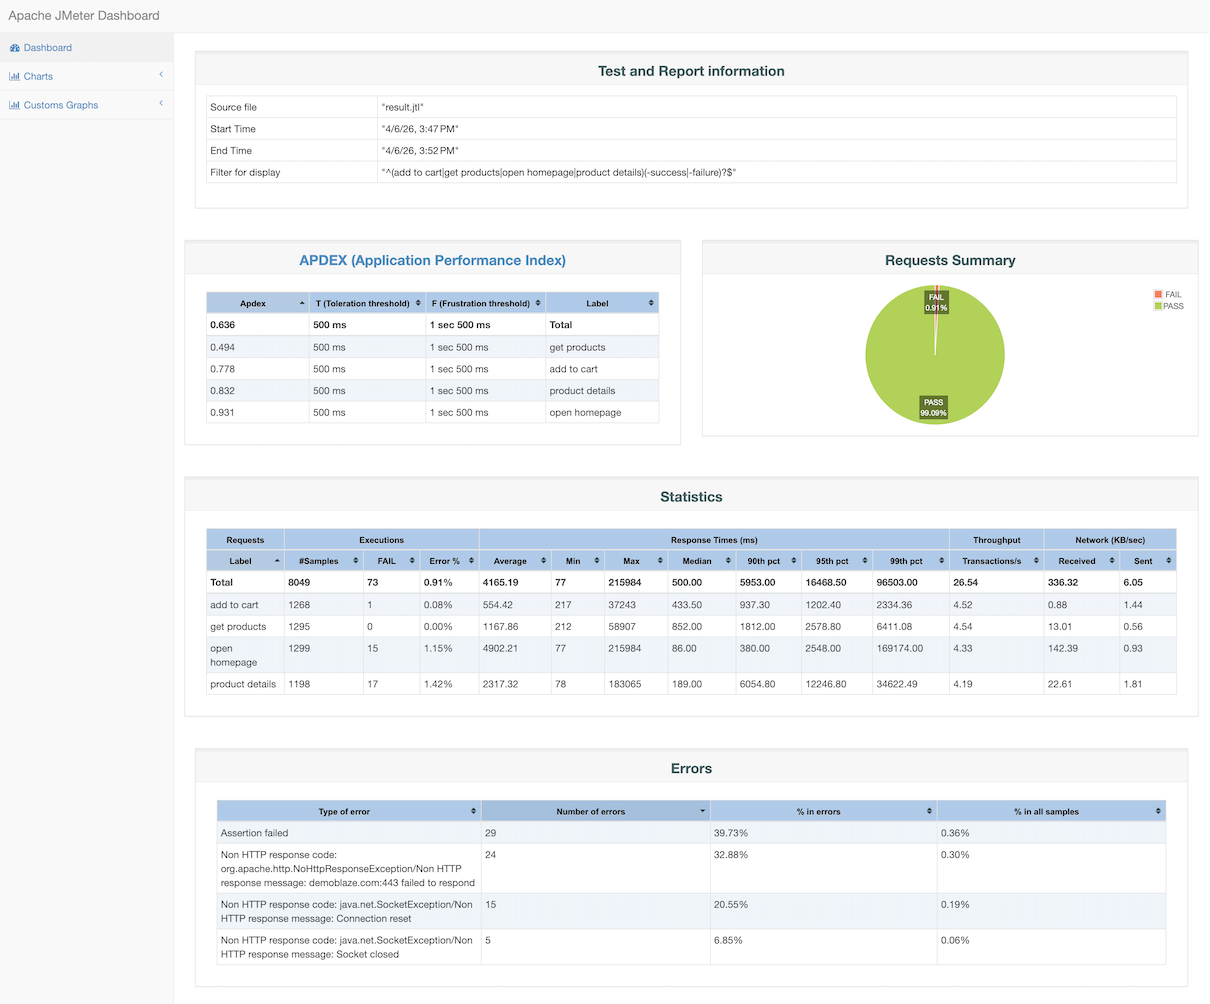
📸 Screenshot: JMeter HTML Dashboard - overview page with statistics table and APDEX.
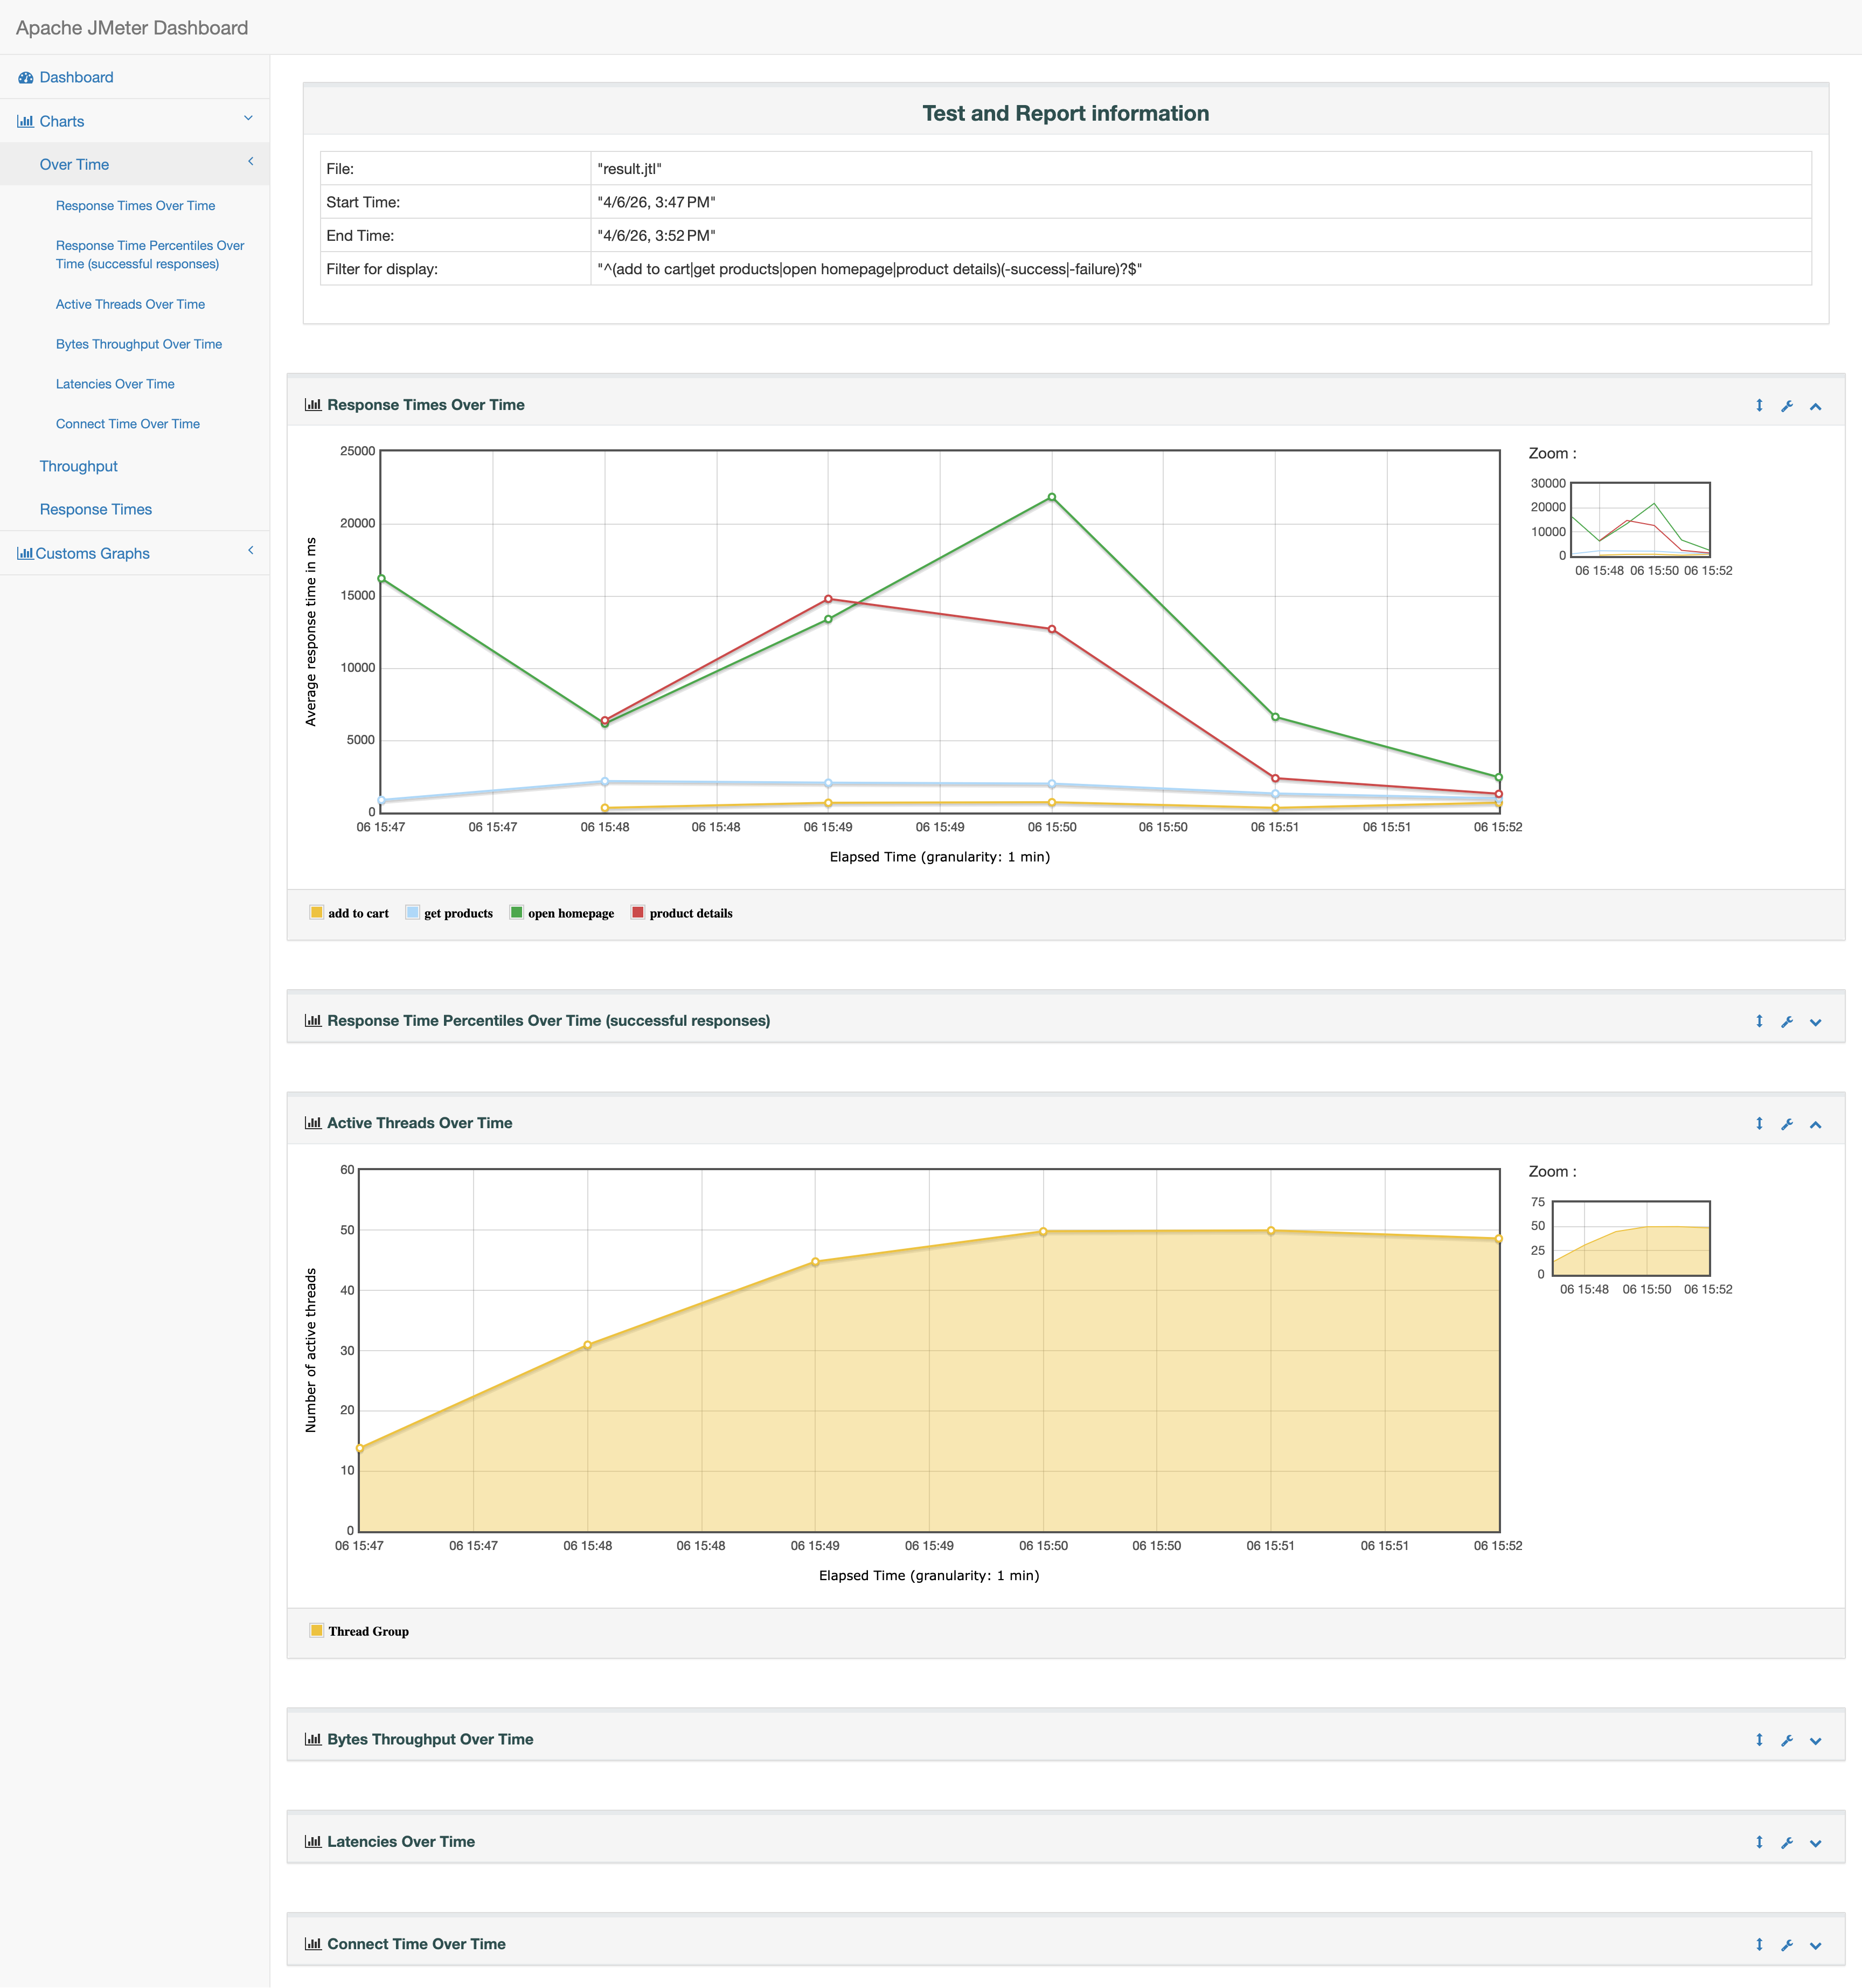
Back to top📸 Screenshot: HTML Dashboard - Response Times Charts.
Customizing the Dashboard
The dashboard is configured via reportgenerator.properties (or override in user.properties):
# Granularity of time-based graphs (in ms)
jmeter.reportgenerator.overall_granularity=60000

# Exclude specific samplers from the report
jmeter.reportgenerator.sample_filter=

# Custom title
jmeter.reportgenerator.report_title=My Load Test Report

# Aggregate transactions only (exclude sub-requests)
jmeter.reportgenerator.exporter.html.series_filter=^(add to cart|get products|open homepage|product details)(-success|-failure)?$
Interpreting Key Metrics
Response Time Percentiles
| Percentile | What It Tells You |
|---|---|
| 50th (Median) | The “typical” user experience |
| 90th | 90 % of users experienced this time or better |
| 95th | Common SLA threshold |
| 99th | Tail latency - worst-case for most users |
| Max | Absolutely worst case (often an outlier) |
SLA Example: “95% of API responses must complete within 500 ms” → check the 95th percentile column.
Throughput
Throughput (requests/second) tells you the system’s capacity. Watch for:
- The load increases but throughput remains the same → the server is close to its breaking point, obvious bottleneck.
- Throughput dropping → the server is overloaded or throttling.
Error Rate
An error rate above 0 % under anticipated load indicates a problem. Common causes:
- Connection timeouts (server overwhelmed or connection pool problems).
- HTTP 5xx errors (server-side errors under load).
- Assertion failures (functional malfunctions).
Sharing Results
Static HTML
The HTML dashboard is a self-contained folder of static files. You can:
- Zip and email it -
zip -r report.zip report-output/ - Host on a web server - drop the folder into Nginx, Apache, or an S3 bucket
- Commit to a Git branch - use CI/CD server like Jenkins, GitHub Pages or equivalent to publish test results
Real-Time Monitoring with InfluxDB + Grafana
For long-running tests, waiting until the end to analyze results is not ideal because you might catch the problem while the test is running. The Backend Listener streams results to an external storage system like Graphite or InfluxDB that can be used as a Grafana Data Source. This allows you to see interim results in a Grafana dashboard while your test is running.
InfluxDB + Grafana Setup
- Add a Backend Listener to your test plan.
- Set the implementation to
org.apache.jmeter.visualizers.backend.influxdb.InfluxdbBackendListenerClientfrom the dropdown. - Configure:
| Parameter | Value |
|---|---|
influxdbUrl | http://influx-db-server:8086/write?db=jmeter |
application | my-app |
measurement | jmeter |
- Open Grafana and either import one of the existing JMeter dashboard templates or create your own dashboard with custom queries to visualize response times, throughput, and errors in real time.
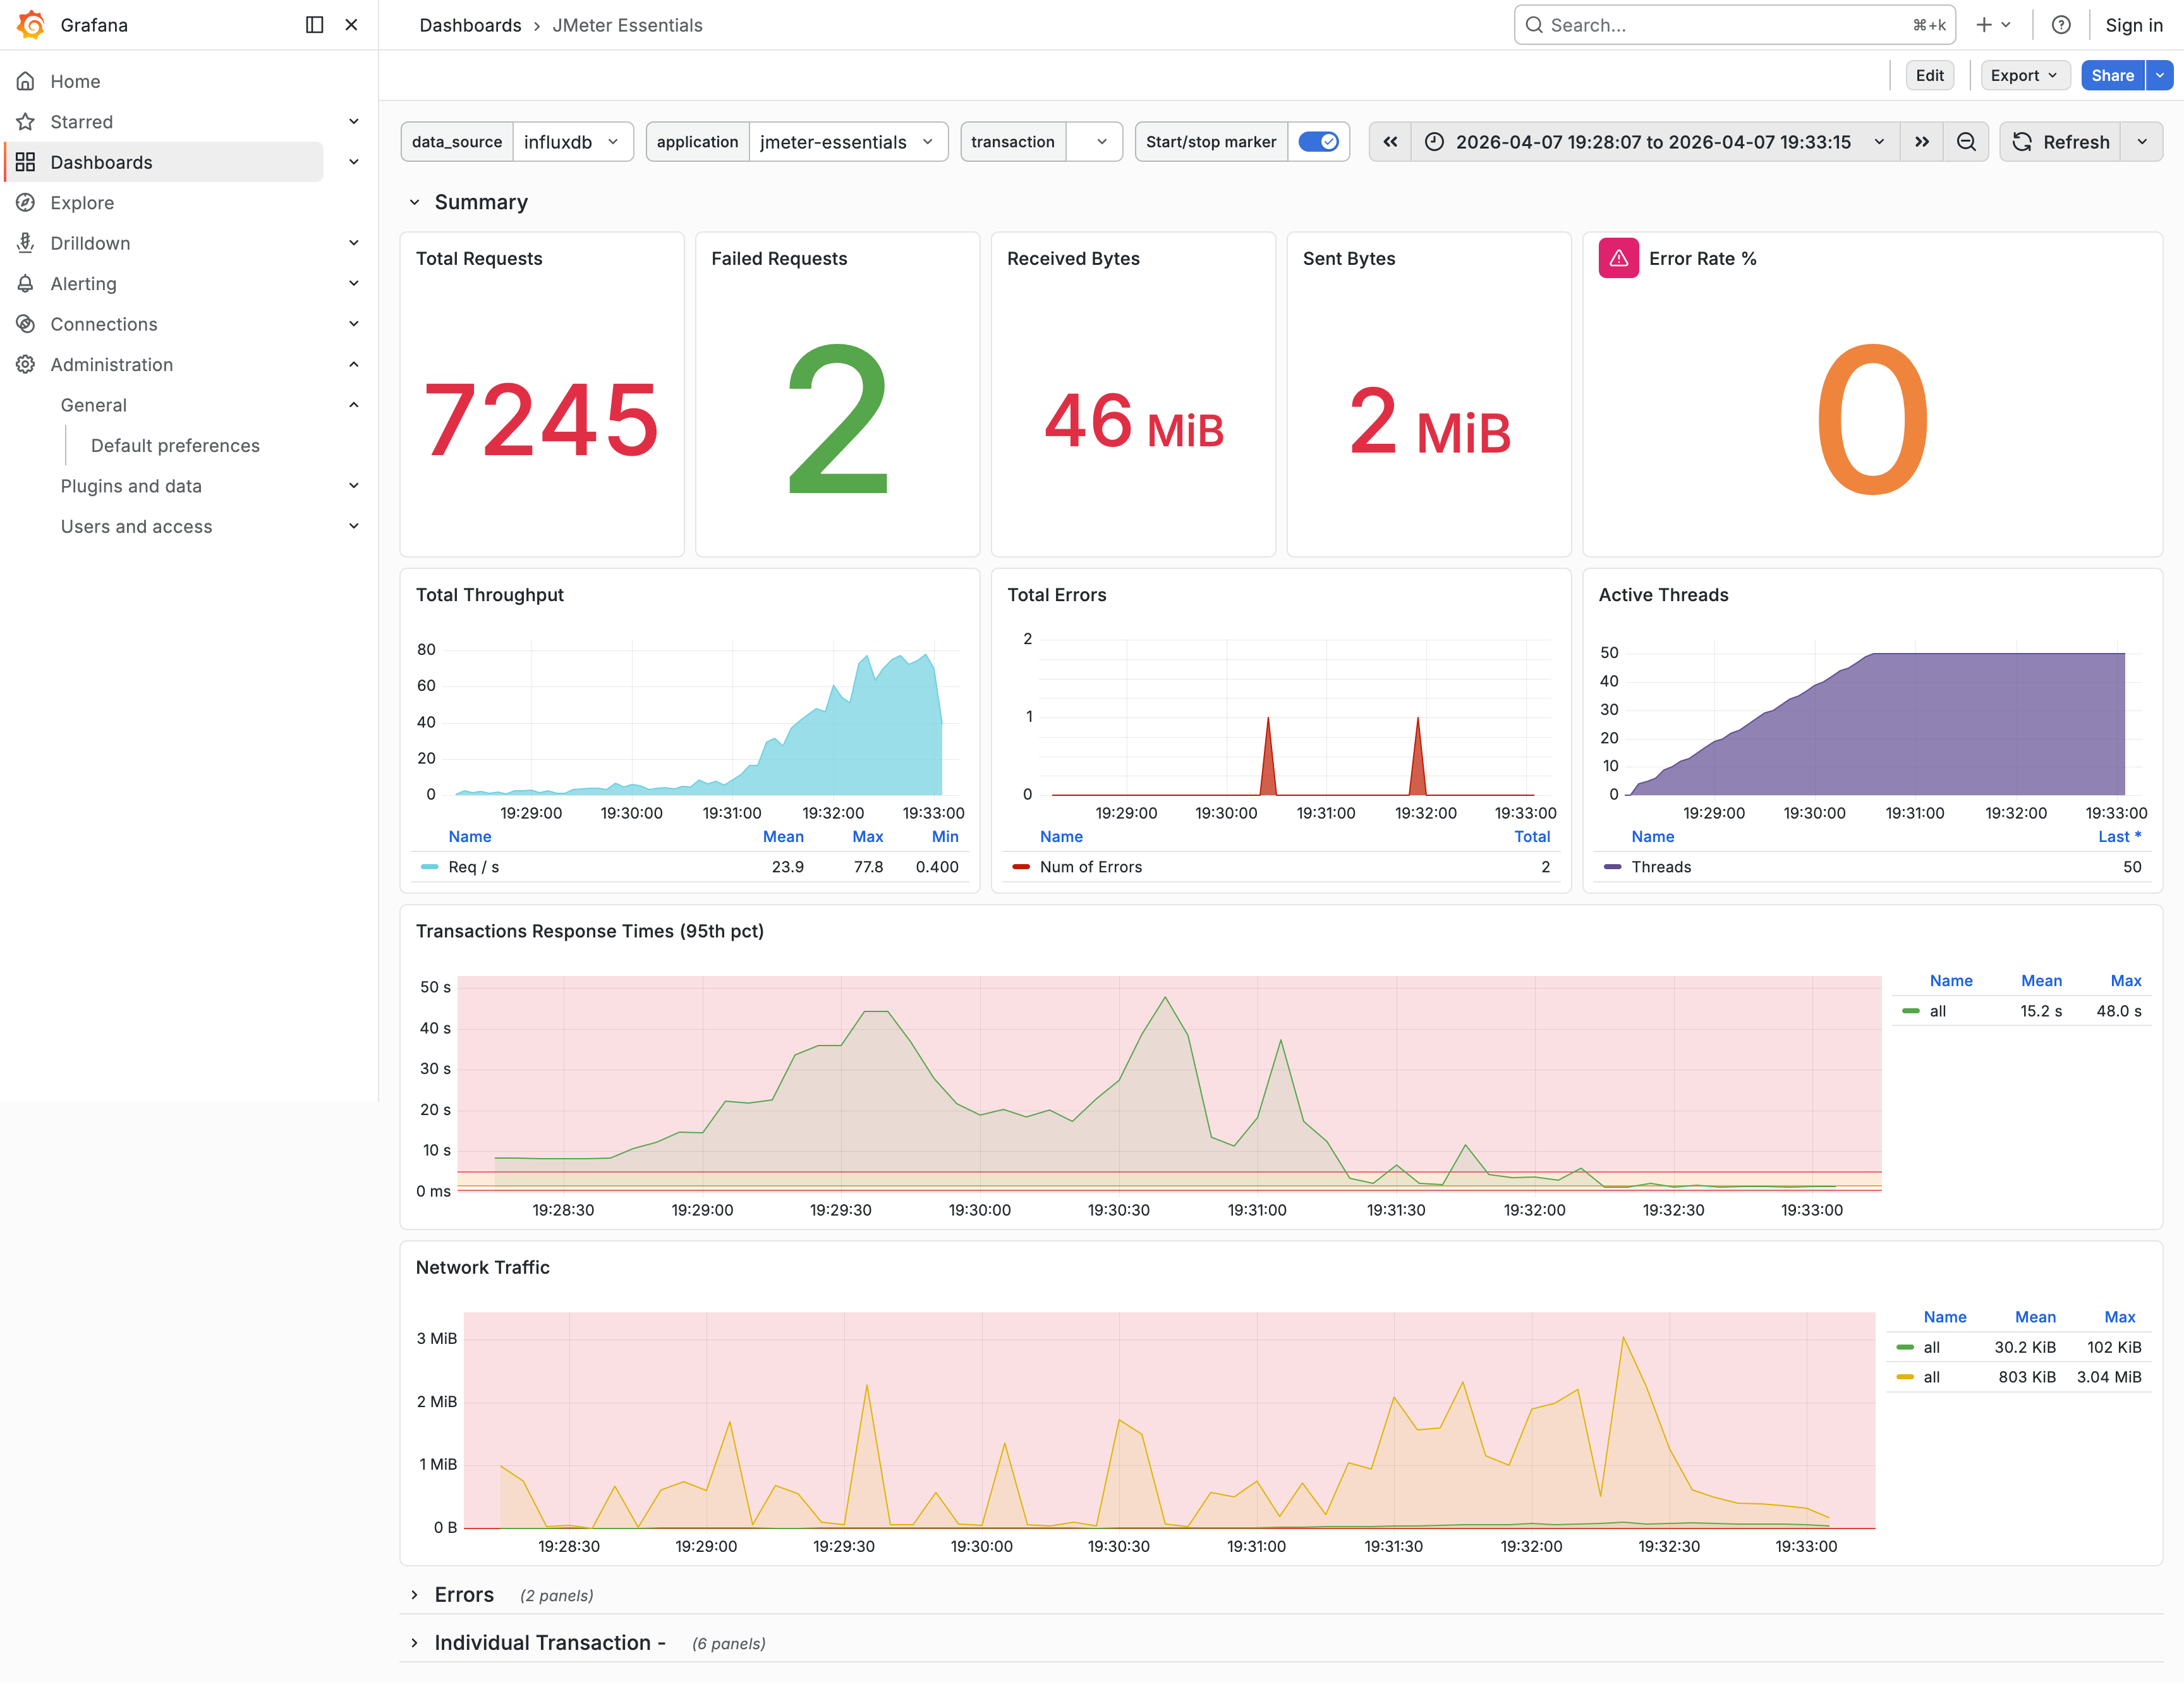
📸 Screenshot: Grafana dashboard showing real-time JMeter metrics.
Cloud-Based JMeter Test Execution and Reporting
For those users and/or teams who don’t want to worry about infrastructure management, reporting, test results retention, and comparison:
- Runs JMeter tests natively in the cloud with real-time reporting and monitoring.
- Provides trends analysis, comparison reports, executive summaries, anomalies detections, AI-assisted results analysis, team sharing and collaboration.
- Supports not only JMeter but awide range of performance testing tools and test automation frameworks.
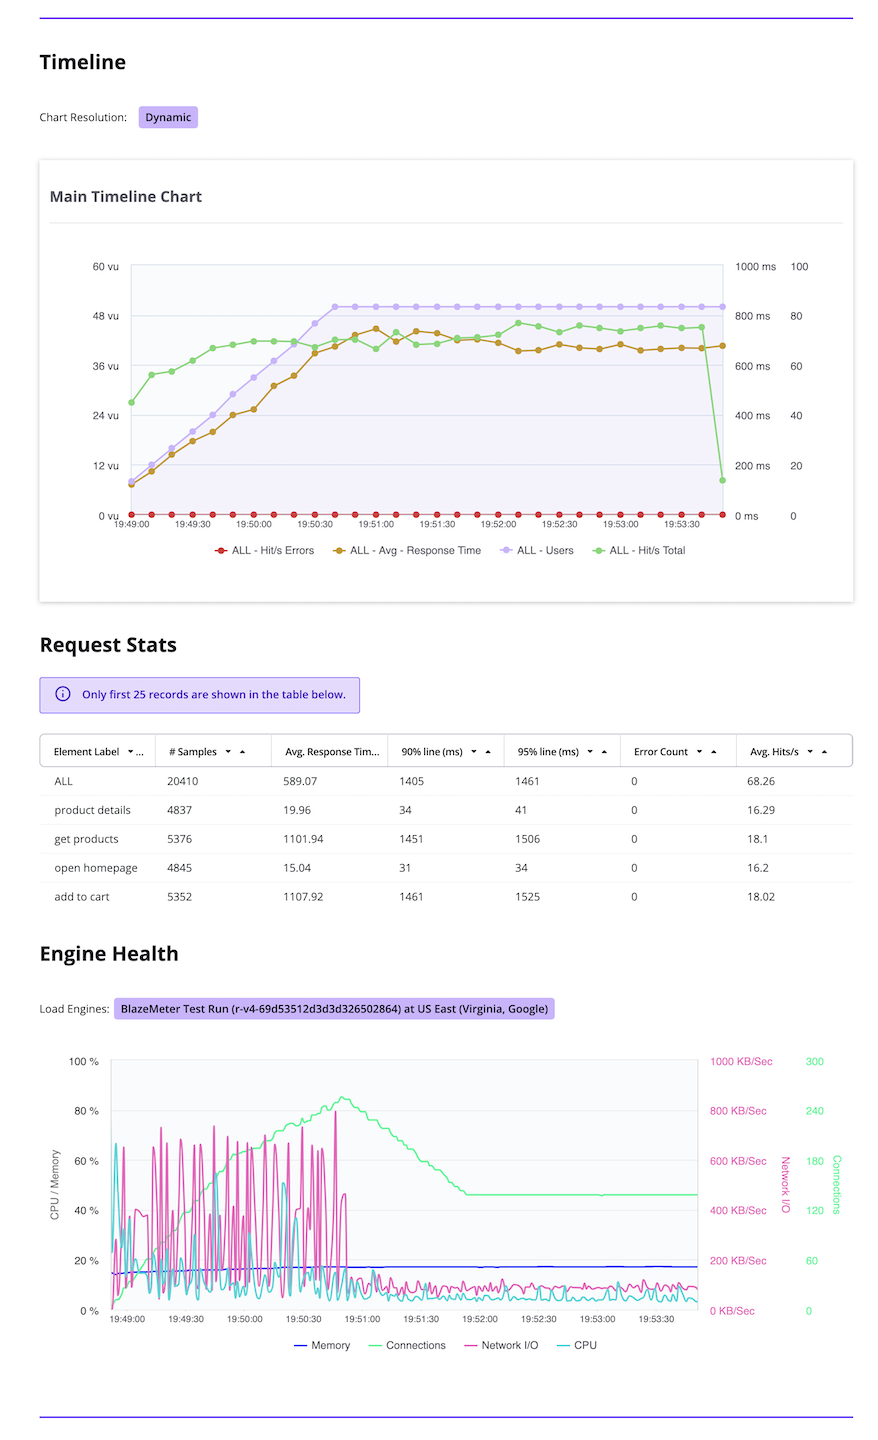
📸 Screenshot: BlazeMeter Summary Report.
Back to topTip: BlazeMeter is 100 % compatible with JMeter
.jmxscripts. You can upload your existing test plan and run it at scale without managing load-generator infrastructure.
Checklist: After Every Test Run
- Review the Error % - are there unexpected failures?
- Check 90th / 95th / 99th percentile response times against SLAs.
- Look at Throughput Over Time - did it plateau or drop?
- Examine Response Times Over Time - did latency increase steadily (memory leak? connection pool exhaustion)?
- Save the
.jtlfile and HTML report for historical comparison. - Log test parameters (threads, duration, environment) with results.
Summary
- The HTML Dashboard (
jmeter -g results.jtl -o report/) produces a comprehensive, shareable report. - Focus on percentiles (not averages) for SLA verification.
- Watch throughput and error rate trends to identify system limits.
- Integrate report generation into your CI/CD pipeline for automated performance gates.
- Use the Backend Listener with InfluxDB + Grafana for real-time monitoring during long-running tests.
- Consider BlazeMeter for cloud-scale testing and advanced trend analysis.