Blog
November 29, 2022

What are the most common performance testing tools available for developers and testers, and how does BlazeMeter size up?
Let’s begin with a quick tour of the most popular platforms. This is by no means a deep-dive, nor an exhaustive list of features, but rather we’ll touch on some of the high points of each offering, then examine what sets BlazeMeter apart from the crowd.
Table of Contents:
Back to top6 Performance Testing Tools You Should Know
LoadRunner
LoadRunner, a former HP product now owned by MicroFocus (and being acquired by OpenText), is a well-known name in the testing world and. It comes in five versions: Professional, Enterprise, Cloud, Developer, and the free Community Edition. It’s billed as “continuous testing for any app”, boasting both performance and functional testing features.
Features include integrations with both IDEs and CI/CD tools, and tests can be created by uploading an existing script, building a scenario within the UI, or recording user actions.
In regard to load testing, LoadRunner’s site claims to support “hundreds or thousands” of concurrent virtual users. There’s a lot of flexibility here, but it depends on which of the five versions are chosen.
Related Reading: Why Enterprises Are Exploring Modern LoadRunner Alternatives >>
LoadNinja
LoadNinja prides itself on simplicity, claiming “anyone on your team” can load test. It provides an embedded test recorder to capture web and API transactions, then allows you to do load testing at scale with customizable scenarios.
The solution offers local options to keep testing inside your network via a private proxy and supports integration with Jenkins, REST API, and various custom CI/CD plugins. It may not be as feature-rich as other products listed here as it is more strictly focused on performance testing with a simple presentation.
This more single-minded focus grants LoadNinja a simpler pricing structure. All features are tied to one product, whereas pricing packages are specific to scaling capacity.
Tricentis
Tricentis is another very popular competitor, but its features are spread across multiple products. qTest handles test management and reporting, Tosca offers codeless testing for a wide range of application types, NeoLoad specializes in performance testing, Test Automation integrates with ServiceNow, Data Integrity automates data quality testing, and finally, LiveCompare produces Data Analytics.
NeoLoad is of particular relevance here as their cloud-based performance testing product. It offers what Tricentis calls “no-code” (built via GUI) and “as-code” options for creating and scaling tests. It boasts the ability to test a wide variety of application types and integrate with many other tools. It’s designed to be friendly to both the veteran tester and non-technical beginner.
Though rich in its offering of features, what you get will depend wholly on what combination of tools you acquire. Whereas LoadRunner’s features depend on the version chosen, Tricentis’s functionality depends on what combination of platforms one opts for, each with its own pricing.
Flood
Flood, yet another one of Tricentis’s product offerings, merits its own mention. Flood lets you build codeless tests through its GUI or upload a JMeter, Gatling, or Selenium script. Tests can be performed on its AWS or Azure cloud engines or on-premise via your own existing machines.
There’s quite a bit of customization available for your tests, as you can scale users, test duration, and ramp-up time, supporting up to tens of thousands of browsers. Like its peers, it offers real-time reporting, APM integration, and an optional on-premise agent.
Flood is more comparable to LoadNinja than others on this list due to its focus on simplicity. It offers one product with pricing packages tied to scalability.
K6
Grafana Labs’ K6, previously known as Load Impact, comes in two flavors. Its open-source package includes both API and CLI tools. You can write tests in JavaScript, then execute them on your local hardware via your command line terminal. Scaling up performance tests will inevitably require paying for the Cloud product, though, which is broken into a variety of pricing packages: Developer, Team, Pro, and Enterprise.
K6’s cloud product offers a web GUI through which one can build a test via its web builder or IDE integration. A recorder captures user journeys and the dashboard displays real-time test reports. Cloud testing supports up to one million users from 21 locations, which may be automated from the web, your CLI, or your CI pipeline.
The tool offers a variety of additional features, most of which are dependent on the pricing package selected. For example, the right package can open up access to reporting, additional security features, private testing options, and APM integration.
OctoPerf
OctoPerf joins LoadNinja and Flood in offering simplicity, specifically claiming a “two-day learning curve”. Tests may be created without the use of any script or by uploading a JMX script.
Performance tests support up to one million users and generate real-time reports. Tests can be executed on the cloud via AWS and Azure engines or via a full on-premise infrastructure that leverages Docker-based agents or the user’s own AWS account. Test scenarios can be recorded via a browser or proxy and OctoPerf supports integration with all Maven-compatible CI/CD servers.
OctoPerf’s features are not gated behind its pricing packages, which are instead tied to scalability.
Back to topWhy BlazeMeter is the Top Performance Testing Tool
All the products above offer a different variety of features, each with different limitations. BlazeMeter easily leads the pack as the best continuous testing tool on the market because it is an extensive swiss-army knife of testing tools, all in one product.
Complete Continuous Testing
Blazemeter is the only product to serve throughout your entire continuous testing journey, end to end.
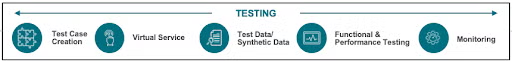
Your testing life cycle begins in Blazemeter as you create your first tests from scratch, then eventually ends in BlazeMeter after your applications are deployed, after which BlazeMeter will continue to monitor your live application’s APIs to ensure maximum uptime.
While the above products offer a variety of software performance testing and other features, only BlazeMeter provides a full suite of everything you’ll need from start to finish, all within one platform and one GUI.
The Power of Taurus
Blazemeter is built on top of Taurus’ architecture, the key ingredient that sets it apart from other platforms
Whereas other products offer a small range of test types, often revolving around JMeter, Gatling, and Selenium, Taurus unlocks a wide range of test options. For example, Taurus enables Blazemeter to run JMeter, Gatling, JUnit, NUnit, K6, Locust, Postman, PyTest, Selenium, TestNG, Vegeta, and many more open-source frameworks – far more than any other platform.
If you're considering moving away from legacy tools, here's why many teams are choosing to Convert LoadRunner Scripts to Selenium for simpler, open-source-driven testing.
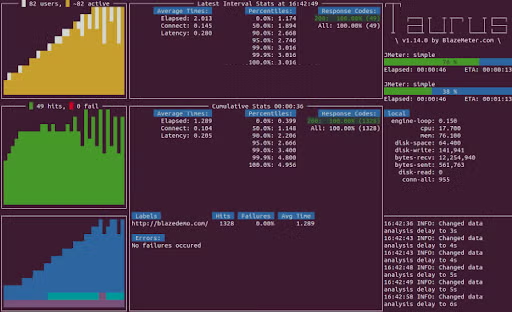
Taurus is open source and therefore may be installed and run on your local machines, entirely for free. You don’t even need to install the other tools it supports; simply tell Taurus which type of test to run, feed it your script, and Taurus will automatically download, install, and configure the tools it needs for the duration of the test. You can watch a live report as the test executes, all within your CLI.
The Widest Variety of Test Options
Having the option to execute functional or performance tests is nice, but BlazeMeter compounds options upon options, ensuring you get exactly the test you need for the objective at hand.
Functional tests come primarily in two forms: GUI tests or API tests. GUI Functional Tests ensure your user’s in-browser experience will meet expectations. You can create a frontend test by uploading your own script, executing a script directly from your IDE, or building a scriptless test within Blazemeter’s UI.
Meanwhile, API Functional Tests can be created via Blazemeter’s API Monitoring feature.
When it’s time to conduct performance tests, BlazeMeter is a powerhouse like no other. You can build a simple API- or URL-based performance test within the GUI, regardless of your level of expertise. Testing experts can upload a JMX script to stick with JMeter or upload a Taurus script to unlock the wide variety of testing tools and script varieties mentioned above.
Sometimes merely scaling a test isn’t enough to simulate true-to-life scenarios. How about scaling multiple tests in tandem? BlazeMeter's Multi-Test can execute a combination of multiple performance tests simultaneously – all at scale, all at once.
Test with Synthetic Data
Not only can you create your tests within BlazeMeter, but you can create synthetic data from scratch as well via BlazeMeter’s built-in Test Data tool. In other words, you can use this feature to create data that reliably mimics your real production data. This is particularly useful when your production data includes Personally Identifiable Information (PII) or similarly sensitive data. Run your tests on BlazeMeter without ever touching your real data.
BlazeMeter’s UI makes building your test data simple. For example, you can generate new test data straight from the UI, load Test Data from a spreadsheet, or integrate BlazeMeter with your Test Data Manager (TDM), among other options (and combinations of options).
Test Within a Simulated Infrastructure
BlazeMeter is the only platform to offer mock services. If you’re in the early stages of testing, you may not yet have the infrastructure ready to execute tests against. No problem – You can simulate the services you need to test against within BlazeMeter. Mock services can then be associated with a test, embedded into your test script, or even provided during your test’s execution.
You can even combine mock services with the aforementioned Test Data feature, which means you can test synthetic data in a simulated environment!
Testing Never Ends
BlazeMeter’s API Monitoring offers options for multiple phases of your testing life cycle. You might first leverage it for your API functional testing, verifying that your APIs function and respond as intended before you move forward into load testing. Building these tests can be as simple or complex as you need. For example, you can build your test through the web GUI for the sake of keeping it simple or leverage the Script Engine to write your own custom JavaScript.
Once the simulations are over and your stable application is released to the world, testing need not and should not end – Ask any live service provider during an outage. API Monitoring tests keep an eye on your API services 24/7/365 and will automatically send you alerts the moment an API stops responding, allowing you to respond immediately and minimize any downtime.
API Monitoring tests are highly customizable. You can integrate your tests with Splunk, Datadog, Keen, New Relic Insights, or Big Panda for advanced analytics. Alerts can be sent to Slack, Microsoft Teams, PagerDuty, VictorOps, or OpsGenie.
Cross-Functional Collaboration
In today’s DevOps world, testing teams often need to work hand-in-hand with other teams specializing in other functions.
BlazeMeter is accessible to all types of users of all experience levels, and functionality can span both agile test teams and your Center of Excellence (COE). Highly technical application testers and developers can easily work alongside less-technical QA testers within the BlazeMeter platform.
Secure Testing, On-Premise or Off
BlazeMeter takes data privacy and security seriously and offers a range of options to meet your specific needs, no matter how demanding.
For many users, BlazeMeter’s cloud is more than sufficiently secure. Tests can be executed via BlazeMeter’s AWS, Azure, or Google Cloud engines, and your designated BlazeMeter administrators can configure a variety of security settings.
That may not be enough, however, especially if your industry’s regulations include strict compliance requirements. BlazeMeter offers on-premise options to cover that. BlazeMeter’s hybrid architecture allows you to install and execute test engines entirely on-premise so that only the resulting performance reports – devoid of sensitive data – are generated on the cloud. Alternatively, you can utilize the private cloud option and install the entire BlazeMeter architecture – from test creation to reporting – in-house, all behind your firewall.
Back to topBottom Line
All of BlazeMeter’s features are tied to one version of one product. You need not worry about selecting a combination of products to get what you need.
The vast majority of BlazeMeter’s options are accessible in all pricing plans, which are mostly tied to scalability.