Blog
January 20, 2021

Apache JMeter is the leading open-source tool for load and performance testing.
For those of you just getting to grips with JMeter testing, we’ve put together a three-part ‘how to’ series on how to use this powerful tool.
In this blog, we’ll focus on how to install JMeter and create test plans. Over the next few weeks, we’ll be tackling how to build test scripts, set up workflows, and run reports and analytics.
Back to topStep 1: How to Install JMeter
- Install JMeter with the latest 64-bit JRE or JDK. This is important because JMeter is a pure Java application.
- Go to Apache JMeter and find the Binary to download to your computer
- Once downloaded, move this file to your preferred location, extract it and go to the folder, and then, the bin directory.
- Take a look. You should see a series of scripts which can run JMeter in various modes.
For JMeter memory profiling, you should always use the latest version of JMeter. Check out these JMeter Release Notes to determine the latest stable version that you should use.
Congratulations! You have all you need to start working on your test plan.
P.S. We recommend using the above method to install JMeter and Java because:
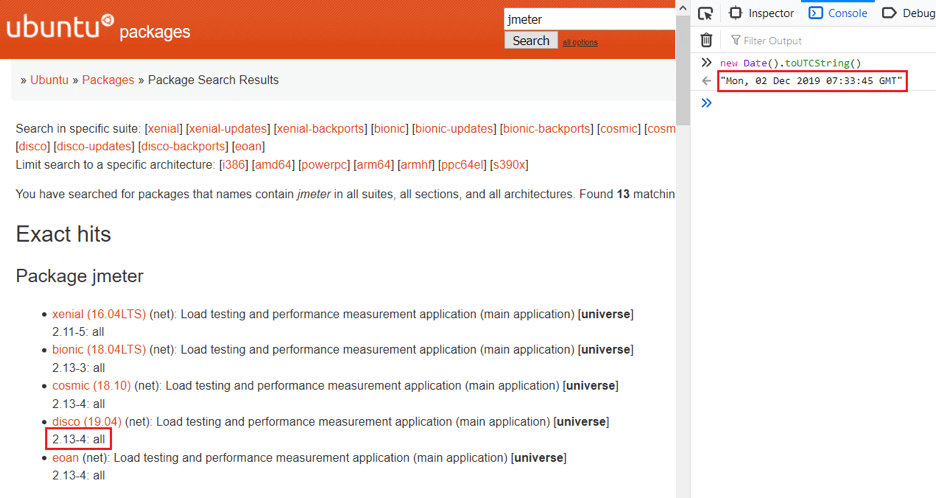
JMeter might be available via the package manager of your Linux distribution. However, the validity of the version can be a big question mark. For example, at the moment Ubuntu (one of the most popular Linux distributions) provides JMeter 5.4 which was released at the end of 2020.
On Mac, it’s possible to use Homebrew to install JMeter and keep it up-to-date, however, it will install JMeter under /usr/local/Cellar/JMeter/x.x/libexec/ folder (or wherever the formula points). This means you might have troubles with configuring JMeter, adding libraries to JMeter Classpath, installing JMeter Plugins Manager, etc.
Although JMeter has all the files you need to build and run most tests, there are some exceptions. For example, you will need to download JDBC driver for database load testing, MQ client libraries for JMS load testing, etc.
Building Your First JMeter Test Plan
Launch JMeter by performing the following:
1. Open the “bin” directory of the JMeter installation in the command-line interpreter application (cmd.exe or Powershell for Windows, Terminal for Mac/Linux/Unix).
2. Type the following command:
For Mac/Linux/Unix: ./jmeter.sh
For Windows: jmeter.bat
Using the command-line interpreter is recommended because if something goes wrong, you will be able to see the output in the console window. If you launch JMeter by double-clicking the icon of its startup script or ApacheJMeter.jar file, you will be uninformed about the failure reason if JMeter won’t start.
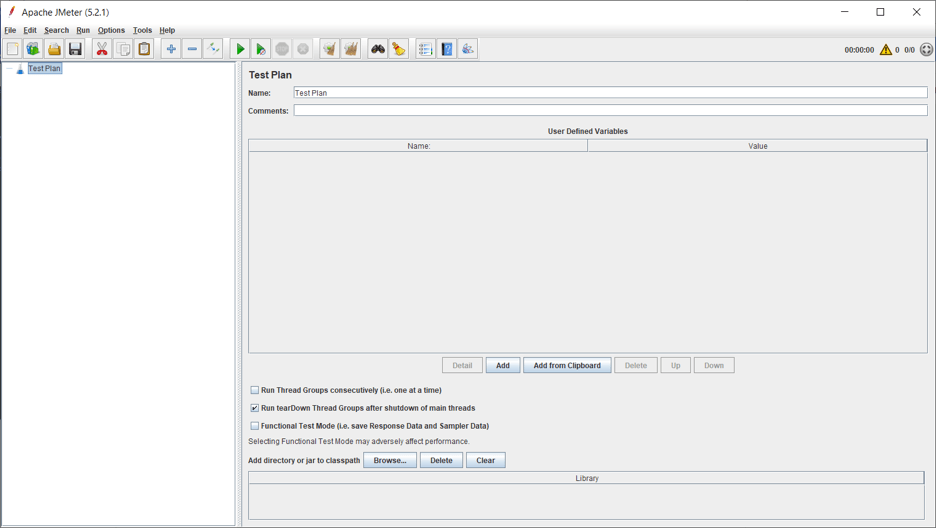
You should now see an empty test plan (like in the image below):
Don’t see the JMeter GUI yet? Check the following:
- The JAVA_HOME environment points to the JRE or JDK installation folder
- The JAVA_HOME/bin folder has been added to the PATH environment variable
- The output of JMeter startup script execution in the command-line interpreter window jmeter.log file (it’s being generated in JMeter’s “bin” folder when you start JMeter
Creating a Complete Test Plan
In your test plan, you should specify the overall settings and outline the steps that you want JMeter to execute while it runs. For your own reference, you can also name it and add comments.
You Need To:
Set Up at Least One Thread Group and Sampler
A thread group is where you specify the number of users that you want to simulate. One thread = one user. By setting the ramp-up period, you can also tell JMeter how long it should take to reach all of the threads that you’ve chosen. You can also set the number of iterations for each user in the group with the Loop Count.
Set up Samplers
Samplers are super important as they perform the actual work in JMeter. JMeter executes the samplers and writes down the results, such as: start time, duration, success, response messages etc. Listeners can be used to view these results (but more about that in a bit). The HTTP Request, which lets you send a HTTP or HTTPS request to a web server, is the most commonly used sampler.
We recommend that you:
Add Timers
Here you can set the duration of the delay from one request to the next (e.g., how many seconds you want JMeter to wait before navigating from the homepage to the features page). Real users don’t hammer the system under test non-stop, they need some time to “think” between operations that’s why it’s important to exactly replicate this behavior to produce a realistic network footprint. Learn more about JMeter timers.
Add Configuration Elements
These allow you to manage elements, like the cache and the cookies, during the test. We recommend adding the “HTTP Cache Manager” and the “HTTP Cookie Manager” to simulate a browser’s behavior. Find out more about making JMeter behave like a real browser in this article.
Add Assertions
These let you define the pass or fail criteria for your test.
Let’s say you want to make sure your site or app responds within 100 milliseconds. You can set a Duration Assertion to specify that if any response lasts longer than 100 milliseconds, the sample will be marked as “failed.”
The most important assertion to know is the Response Assertion. This covers 99% of your needs — so no wonder it’s so popular! You can use it to test the URL, response body, messages, embedded resources, redirects, headers and more. This assertion gives you loads of flexibility as it lets you test regular expressions rather than text patterns. JMeter handles regular expressions in a very similar way to Perl — except you don’t enclose the expression in //’s.
Add Listeners
As I mentioned earlier, these let you view the results of a sampler. You can choose to view them in various formats, including a table, graph, tree, or log file. Listeners can be added anywhere in the test - but it’s important to know that they will only collect data from elements on the same level or below.
View Results Tree is the most commonly used listener as it presents all the test plan results in a user-friendly tree structure. Other listeners include the Assertion Results, Aggregate Report and Beanshell Listener.
One important thing to note: when you actually run the load tests, you should disable all your listeners as they use up a lot of memory. There will be more details about dos and don’ts for running tests in the next blog post in this series.
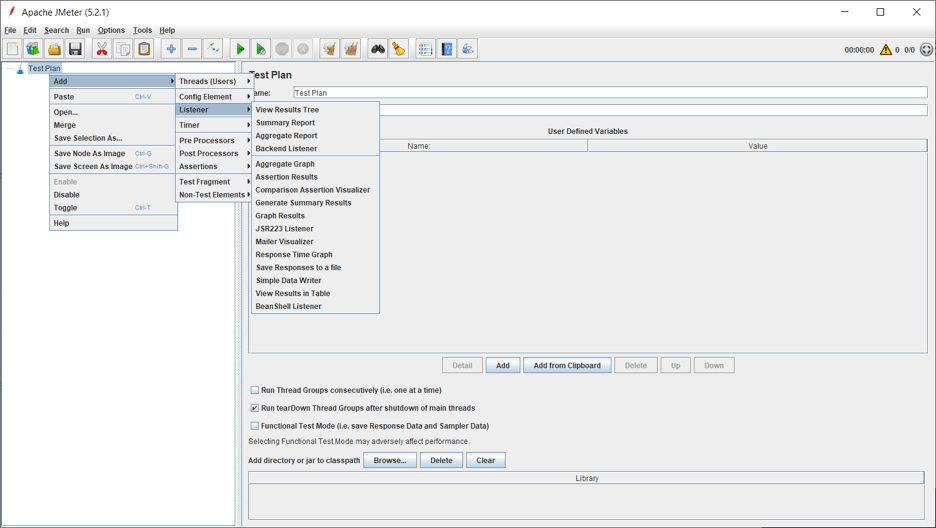
Back to topHow to Add Components to Your Test Plan
You can set up and add all of these components in the test plan before you run it. Here’s how:
Right click on the name of your test plan
Select ‘Add’
Choose the component you want to set up and configure
That’s it! Need more JMeter training? Check out our free BlazeMeter University to get your free JMeter certification.
If you have any questions or comments, please share in the comments box below.
How BlazeMeter Supports and Strengthens JMeter
While JMeter represents a strong and compelling way to perform load testing, of course, we recommend supplementing that tool with BlazeMeter, which lets you simulate up to millions of users in a single developer-friendly, self-service platform. With BlazeMeter, you can test the performance of any mobile app, website, or API in under 10 minutes. Here’s why we think the BlazeMeter/JMeter combination is attractive to developers:
- Simple Scalability – It’s easy to create large-scale JMeter tests. You can run far larger loads far more easily with BlazeMeter than you could with an in-house lab.
- Rapid-Start Deployment – BlazeMeter’s recorder helps you get started with JMeter right away, and BlazeMeter also provides complete tutorials and tips.
- Web-Based Interactive Reports – You can easily share results across distributed teams and overcome the limitations of JMeter’s standalone UI.
- Built-In Intelligence – BlazeMeter provides on-demand geographic distribution of load generation, including built-in CDN-aware testing.
BlazeMeter doesn’t just offer performance testing. Now it’s a full Continuous Testing platform that incorporates over 20 leading open source testing tools for load testing, API testing, GUI Functional Testing, and Mock Services.