Blog
April 21, 2021

The IBM MQ docker is a message-oriented middleware (MOM) infrastructure that's great for testing! In this blog, we break it down.
Back to topIBM MQ Docker Basics
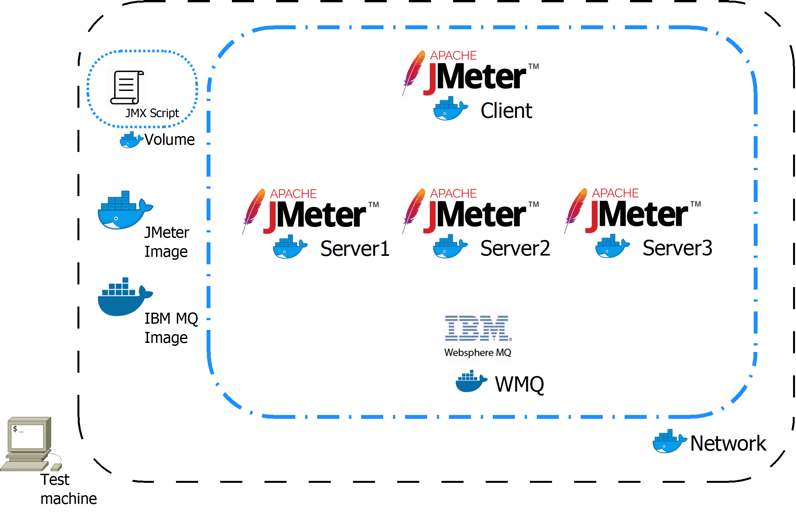
A Description of Our Working Scenario
The working scenario in this paper is composed by two main Docker images:
- JMeter is the test application. Unlike previous articles, it’s not mandatory that JMeter runs on a container. In the context of this paper, JMeter will run on a container only for simplicity and the reliability of proposed example. You can also use JMeter from your local machine.
- IBM MQ is the application under test. It will be configured to work on a Docker container with two application scenarios:
- An unsecure communication channel
- A secure communication channel based on TLS
Configuring the JMeter Container
The JMeter container described in previous articles is still valid and the required functionalities are all accessible via the standard arguments when the docker run command is executed.
At the end of previous paper there were two available versions of JMeter 4.0 containers (see on github). The difference between the two versions is related to the distributed running mode:
- without the SSL channel between the client and server
- with the SSL channel between the client and server
For the scope of this paper and to avoid over complication during setup, we will adopt the first version without SSL.
The complete Docker container code with Dockerfile and all the necessary files is available here on GitHub.
As already discussed, for the scope of this paper, JMeter can be used in various operation modes:
- A single application with a GUI (not related to Docker)
- A single docked container without a GUI
- Multiple Docker containers in distributed mode
In this paper we are using the distributed mode with Docker containers.
Preparing JMeter Plugins jars
The example proposed in this paper is based on a JMeter script that requires a set of JMeter plugins. Here is how to act on a JMeter classpath and provide the required plugins jars to a JMeter application, instead of following the regular process via the GUI.
Bash
#!/bin/bash

BASE_HOST=http://central.maven.org/maven2/

declare -a JARS_LIST=(
"javax/jms/javax.jms-api/2.0.1/javax.jms-api-2.0.1.jar"
"kg/apc/jmeter-plugins-cmn-jmeter/0.5/jmeter-plugins-cmn-jmeter-0.5.jar"    "kg/apc/jmeter-plugins-graphs-additional/2.0/jmeter-plugins-graphs-additional-2.0.jar"  "kg/apc/jmeter-plugins-graphs-basic/2.0/jmeter-plugins-graphs-basic-2.0.jar"
"kg/apc/jmeter-plugins-perfmon/2.1/jmeter-plugins-perfmon-2.1.jar"
"kg/apc/perfmon/2.2.2/perfmon-2.2.2.jar"
)

for JAR in "${JARS_LIST[@]}"
do
    $(curl -L --silent -O ${BASE_HOST}${JAR})
done

mkdir shared && mv *.jar ./shared/
The “shared” folder created with the script above will be used in the JMeter container docker run command:
- as the Docker volume to be added to the running containers filesystem
- as the “user.classpath” property for the JMeter application executed in the containers
By using this procedure in combination with Docker we have achieved:
- plugins classpath transparency - we know exactly which jars were installed
- avoiding jars file duplication among multiple containers
- maintaining the JMeter container independent with the required plugins
(If you’re using local JMeter, just use the regular JMeter plugins).
Now, it’s time to complete the container setup. For our example we require another jar dependency related to the Java driver for IBM MQ. We will now describe how to fetch that.
Back to topHow to Configure the IBM MQ Docker Container
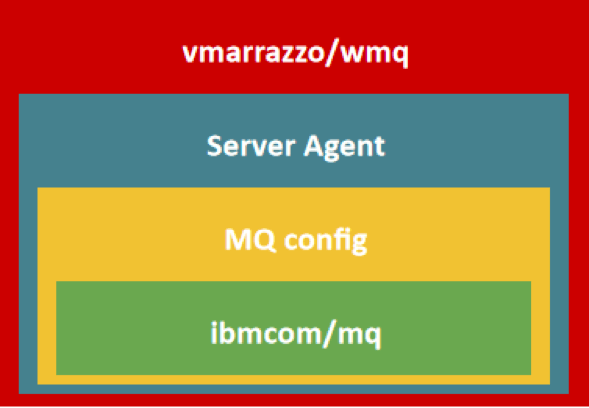
IBM MQ is the application under test and it’s released into our working environment via a Docker container. The image for this container is called ibmcom/mq. It is available on Docker Hub, and the source code is on github.
We won’t use this image directly but rather we will handle a derived image, which we will customize. The Docker image used in this example is called “vmarrazzo/wmq”, and you can find it here on GitHub. This new image will be customized with the following points:
- adding IBM MQ configuration to test more usage scenario
- adding test facilities to improve the obtained test results
The next sections describe how to apply customization to this docker image. You can find the complete code on github.
Configuring the Queue Manager
The base image “ibmcom/mq” is configured to have a single queue manager that handles a unique kind of connection. With the environment variable passed with the docker run command, it’s possible to define if the queue manager handles secure or unsecured communication protocols with clients.
The IBM MQ application installed into “vmarrazzo/wmq” is configured to work with two queue managers at the same time:
- QM_WITHOUT_TLS - a queue manager that allows an unsecure connection protocol
- QM_WITH_TLS - this queue manager adopts the TLS protocol for connections with clients. To setup this queue manager correctly, it's necessary to add an additional step related to the creation of the pair of keys to be used by TLS (see below for further details).
To obtain the IBM MQ configuration in the “vmarrazzo/wmq” image it’s necessary to proceed with:
- scripting in Bash to alter the boot chain of the “ibmcom/mq” image
- scripting in WebSphere MQ Script (MQSC) commands
MQSC scripting is a powerful tool that covers a large number of IBM® MQ platforms. For the scope of this document it’s important to know that:
- it is possible to configure an IBM MQ application in textual mode
- every script line that does not start with an asterisk, is a command
It’s out of the scope of this article to explain how to develop the IBM MQ configuration, but a few code snippets are added below to help you.
MQSC
DEFINE QLOCAL('DEV.QUEUE.1') REPLACE
DEFINE QLOCAL('DEV.QUEUE.2') REPLACE
DEFINE QLOCAL('DEV.QUEUE.3') REPLACE
This script shows how the queue is configured into the current queue manager (defined by context).
MQSC
DEFINE LISTENER('DEV.LISTENER.TCP') TRPTYPE(TCP) PORT(1414) CONTROL(QMGR) REPLACE
START LISTENER('DEV.LISTENER.TCP')
This script shows how to assign the listening port to 1414 to the current queue manager and to start this socket.
For further details on MQSC scripting see this link.
Setting Up a Secure Connection with TLS
By default, the connection to the queue manager does not adopt a secure channel over the network. For the “QM_WITH_TLS” queue manager we modify the configuration by adding the TLS protocol to accept an incoming connection only when it uses a cryptographic algorithm with (of course) the right encryption key.
So to proceed furthermore with the TLS protocol we need a trust key. How can you find one? With the keytool utility distributed with Java Runtime or Developer Kit.
The keytool utility is a general purpose application that is useful for managing public/private key pairs. In our example this utility performs three tasks:
- Generating a public/private key pair
- Saving the generated key in the Java keystore (jks)
- Converting the Java keystore in PKCS #12 archive format (pfx)
Bash
#!/bin/sh

# config section
ALIAS_NAME=my-alias
KEYSTORE_NAME=my-cert
VALIDITY_DAYS=365
PASSWORD=changeit

echo "#### Create a new Java keystore with public/private key pair"

# genkey in jks
keytool -genkey \
    -keyalg RSA \
    -keysize 2048 \
   -dname "CN=Vincenzo Marrazzo, OU=Java, O=Docker, L=Milano, S=Italia, C=IT" \
    -alias ${ALIAS_NAME} \
    -keystore ${KEYSTORE_NAME}.jks \
    -storepass ${PASSWORD} \
    -validity ${VALIDITY_DAYS} \
    -keypass ${PASSWORD}

echo "#### Convert Java keystore to PKCS #12 format"

# convert jks to pfx
keytool -importkeystore \
    -srckeypass ${PASSWORD} -destkeypass ${PASSWORD} \
    -srcstorepass ${PASSWORD} -deststorepass ${PASSWORD} \
    -srcalias ${ALIAS_NAME} -destalias ${ALIAS_NAME} \
    -srckeystore ${KEYSTORE_NAME}.jks -destkeystore ${KEYSTORE_NAME}.pfx \
    -deststoretype PKCS12
The script shown above is available here on GitHub. The script:
- #1 creates a new public/private key pair and saves it to the Java keystore
- #2 converts the saved Java keystore to PKCS #12 format
The PKCS #12 file is used by the IBM MQ application to setup a TLS communication channel.
The Java keystore file is used by JMeter during test execution to establish a secure connection by using the IBM MQ driver.
Setting the PerfMon Server Agent
The "vmarrazzo/wmq" image not only improves the related IBM MQ configuration, but also provides an example of a test facility to improve test execution.
The installed test facility is the PerfMon Server Agent. This agent is based on the client-server model and provides information about machine statistics (e.g. CPU, memory and network usages) that can be read by JMeter during test execution with the PerfMon plugin. The complete setup for this plugin into our test scenario requires:
- adding the plugin’s dependencies to the JMeter application classpath
- executing an agent that exports machine statistics via UDP/TCP socket to the container under test
- adding the PerfMon listener and configure this listener to collect container under test stats to the JMeter script (see this article for details).
Preparing the IBM MQ Driver jar
The JMeter script presented in this paper requires the Java driver for the IBM MQ application to work correctly. How can we find it? Fetch it directly from running container based on “vmarrazzo/wmq” image.
docker cp \ :/opt/mqm/java/lib/com.ibm.mq.allclient.jar \ shared/com.ibm.mq.allclient-9.0.4.0.jar
The command above has a structure similar to the Unix command scp and contains the following:
- the base command is “docker cp” that copies the folder/file from/to the container
- the “container_id” from where we copy the jar file
- after “:” there is the absolute jar path to be copied
- after a single space the name of the destination file on host filesystem
Using the command above, with the container id, the “shared” folder is completed and ready to be added into the JMeter classpath.
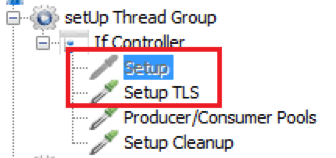
Creating the JMeter Test Script
The test script used in this paper has a structure similar to the script described in the previous article on IBM MQ testing. In this article the script introduce some differences related to:
- double connection setup node
- a producer/consumer pool (instead of destroying the objects)
- a listener to collect statistics
The complete test script described in this section is available here on GitHub. The main thing to notice is how to resolve the address of "under_test_machine". When testing a NOT docked application, you can use an ip address. But when testing a docked application, you can use the container IP or the container name (the Docker network resolves the IP for you).
Double Connection Setup Node
The doubling connection setup node makes it possible to configure a test with/without TLS acting on enable/disable node status.
As already seen in the previous article on IBM MQ testing, these steps are taken in the “JSR223 Sampler”. This sampler is based on Groovy code and sets up a connection to the app under test, to be used in the successive part of the script. This scripted part performs:
- get the “under_test_host” variable to discover the machine/container under test
- setup and share objects required for MQ testing like “Session”, “Connection” and “Destination”
Producer/Consumer Pool
Instead of continuously creating/destroying the producer/consumer, we have added an additional setup step that creates two “pool handlers”. These handlers share the available producer/consumer to all JMeter threads during test script execution, in a concurrent manner. Each JMeter thread is not aware of the logic behind the producer/consumer allocation and works with the allocated object without any other thread interference.
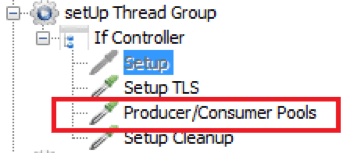
You can read a detailed Groovy implementation of this solution directly on github in the jmx script file. This part describes how the “JSR223 Sampler” handles the producer/consumer.
Groovy
    // book an available producer
    producer = System.getProperties().get("ProducersPool").get()


    // proceed with test logic


    // free the used producer
    System.getProperties().get("ProducersPool").free(producer)
During the execution of the “Producer Sampler”:
- Fetch the reference of “pool handler” called “ProducersPool”
- Book an available producer by using the “get” method
- this method executed concurrently by more threads grants that a shared object is allocated to one and only one thread.
- the returned producer object is reserved only for this thread
- Execute our test logic (e.g. send one message)
- Free the used producer that returns available for the pool (typically this operation is the last of the sampler)
Listener to Collect Statistics
The PerfMon listener is placed at the end of the script. It is configured to acquire statistics from ${under_test_host}.
This is a JMeter variable filled at runtime with the IBM MQ container name, so the Docker network reserves the correct IP address for the container.
How to Execute the IBM MQ Docker Test
As usual, here is the entire test scenario with a Linux shell script and steps description.
Bash
#!/bin/sh

# 0
echo "Reset environment on docker-machine"
docker ps | grep -v CONTAINER | awk '{print $1}' | xargs --no-run-if-empty docker stop && docker ps --filter "status=exited" | grep -v CONTAINER | awk '{print $1}' | xargs --no-run-if-empty docker rm \
    && docker network prune -f

# 1
SUB_NET="172.18.0.0/16"
CLIENT_IP=172.18.0.23
declare -a SERVER_IPS=("172.18.0.101" "172.18.0.102" "172.18.0.103")
WMQ_IP=172.18.0.77

# 2
timestamp=$(date +%Y%m%d_%H%M%S)
volume_path=$(pwd)
jmeter_path=/mnt/jmeter
TEST_NET=mydummynet

# 3
echo "Create testing network"
docker network create --subnet=$SUB_NET $TEST_NET

# 4
echo "Under Test WMQ"
export ks_file=my-cert.pfx && \
export ks_pass=changeit && \
docker run \
  --env MQ_DISABLE_WEB_CONSOLE=true \
  --env MQ_TLS_KEYSTORE=/var/ks/${ks_file} \
  --env MQ_TLS_PASSPHRASE=${ks_pass} \
  --publish 1414:1414 \
  --publish 1415:1415 \
  --publish 4444:4444 \
  --net $TEST_NET --ip $WMQ_IP \
  --detach \
  --volume qm1data:/mnt/mqm \
  --volume "$(pwd)":/var/ks \
  --name wmq \
  vmarrazzo/wmq

echo "Wait time for IBM MQ boot procedure...."
read -rsp $'Press any key to continue...\n' -n1 key

# 5
echo "Create servers"
for IP_ADD in "${SERVER_IPS[@]}"
do
    docker run \
    -dit \
    --net $TEST_NET --ip $IP_ADD \
    -v "${volume_path}":${jmeter_path} \
    --rm \
    jmeter \
    -n -s \
    -Juser.classpath=${jmeter_path}/shared \
    -Jclient.rmi.localport=7000 -Jserver.rmi.localport=60000 \
    -Jserver.rmi.ssl.disable=true \
    -j ${jmeter_path}/server/slave_${timestamp}_${IP_ADD:9:3}.log
done

echo "Wait time after JMeter Server boot procedure...."
read -rsp $'Press any key to continue...\n' -n1 key

# 6
echo "Create client and execute test"
docker run \
  --net $TEST_NET --ip $CLIENT_IP \
  -v "${volume_path}":${jmeter_path} \
  --rm \
  --env JMETER_DEBUG=false \
  --publish 8000:8000 \
  jmeter \
  -LDEBUG \
  -n -X \
  -Juser.classpath=${jmeter_path}/shared \
  -Jclient.rmi.localport=7000 \
  -Jserver.rmi.ssl.disable=true \
  -R $(echo $(printf ",%s" "${SERVER_IPS[@]}") | cut -c 2-) \
  -Gunder_test_host=$WMQ_IP \
  -t ${jmeter_path}/ibmmq_docker_4.0_PerfMon.jmx \
  -l ${jmeter_path}/client/result_${timestamp}.jtl \
  -j ${jmeter_path}/client/jmeter_${timestamp}.log
- #0 here as usual a general reset using a commands pipe is proposed. This is an optional step.
- #1 definition of network information for all the containers involved
- #2 related paths to other variables and the timestamp to be used in files labeling
- #3 creation of the Docker network to connect all containers
- #4 execution of the IBM MQ container. It is visible that the file “my-cert.pfx” must be present in the current folder and passed into the container via the Docker volume. This command configures of three export ports:
- 1414 for the simple queue manager
- 1415 for the TLS queue manager
- 4444 for the Server Agent that exports statistics for the PerfMon plugin
- #5 execution of all the JMeter server instances. Here, the current folder is passed into the container as a Docker volume. This configuration simplifies:
- passing the “shared” folder to be used in the “user.classpath” property
- passing the “my-cert.jks” file with the cryptography key
- #6 execution of JMeter the client instance passing the test script. The following are passed to this instance:
- server instances list
- “user.classpath” property
- global variable to be shared among servers containing the machine name under test using the “-Gunder_test_host” variable
- #7 saving the statistics report on the “client” folder
At #4 there is an intermediate step required when the PerfMon plugin is used:
- Connect to the IBM MQ container with the command docker exec --tty --interactive $(docker ps -q) bash
- Execute the startup command for the Server Agent from the container shell nohup /opt/ServerAgent/startAgent.sh --loglevel debug &
To simplify this operation, “wait”s were included in the complete bash script to execute the required command.
Reading and Analyzing Test Reports
At the end of the test scenario execution, we have three kinds of report files:
- log files, useful during the test development phase
- a jtl file with sampling statistics
- a jtl file with IBM MQ machine statistics
To save unnecessary resources during test execution it's suggested to:
- disable every graphical listener
- leave a few text listeners to save on the file data to be post-processed
After test completion, you can find jtl report files in the “client” folder (as specified into bash script. These files can be formatted in a picture using the listener in the JMeter GUI as necessary.
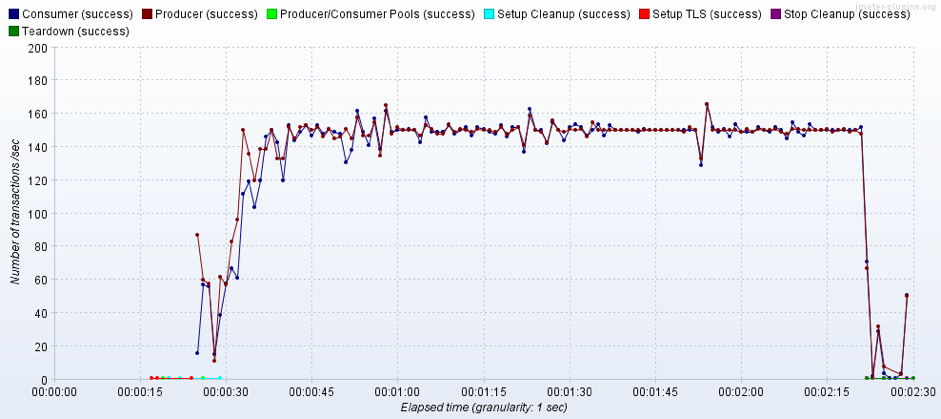
The picture above presents an example of the “Transactions per Second” listener report.
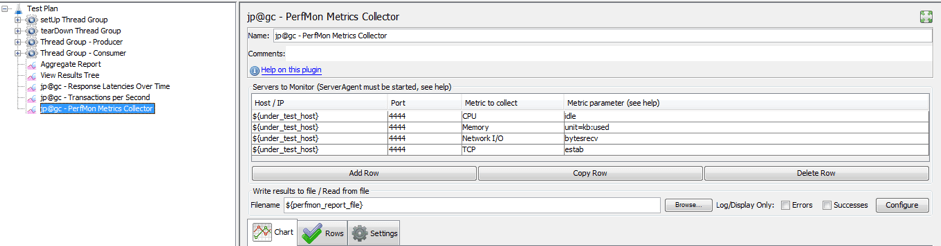
The picture above describes an example of the “PerfMon Metrics Collector” listener report. This image contains all the tracked statistics, so to simplify analysis it is suggested to un-check some of them into the “Rows” tab and analyze them separately.
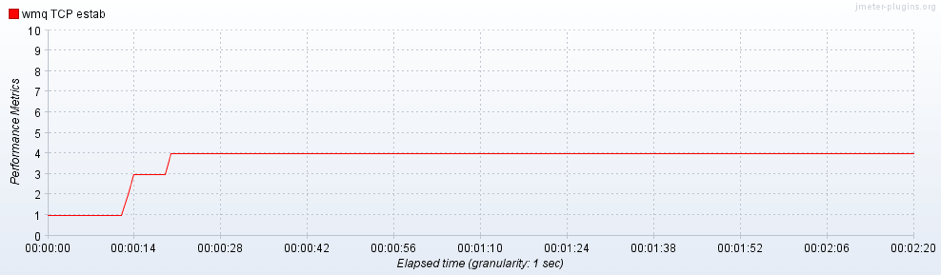
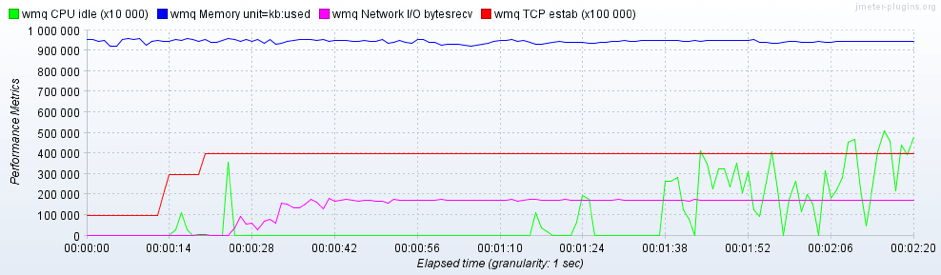
In the picture above you can see the number of connections received by the tested container:
- the first connection is the “PerfMon” plugin that engages the Server Agent
- the successive three connections are related to the three JMeter server instances that establish one connection for each
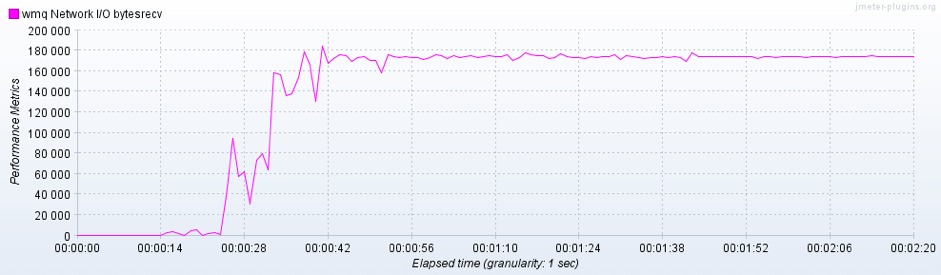
In this picture it is possible to see the received bytes during the entire test execution. In particular it’s shown that after a transitory period the byte rate become constant.
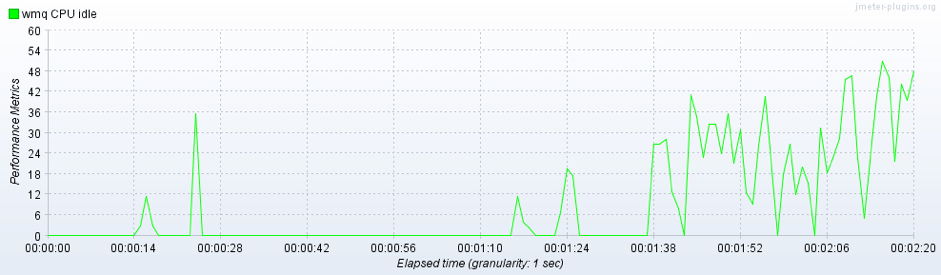
In the last presented picture you can see the “CPU idle time”. This graph can be used to investigate if the presence of spikes is related to specific test phases and why (e.g. producer/consumer pools creation).
Load Testing a Containerized App on BlazeMeter
When running a performance test on a containerized app on BlazeMeter, ensure your port is open to the world (in the firewall). Then, upload your JMX file and run your test.
You will be able to scale your tests to many users and multiple geo-locations, share reports and tests, enjoy advanced and insightful reports over time and integrate with CI and APM.
Conclusion
In this paper we have continued to explore the facilities offered by Docker. We have focused on the application under test available as a container and how we can customize some of its configuration for testing purposes. Moreover, we have also added a modified container under test to improve testing reporting by adding a statistics collector.
In this example JMeter is also running on a container, but there is no limit to use an application without any container to perform the test. The only joint point to take into consideration is the network setup, which must provide the correct access (e.g. port forwarding over container or over virtual machine).
Learn more advanced JMeter from BlazeMeter University.