Blog
March 30, 2023

Apache JMeter™ is a powerful tool for load testing. By default, JMeter has many features, but one of the best things about JMeter is that it is open source software! Therefore, any interested party can develop additions that will extend its capabilities and insert functions. These additions are called Plugins. Developers have already created a large variety of useful plugins, which is really cool and shows the strength of the JMeter community.
There are a lot of available plugins for JMeter testing. We can search through the 70+ available plugins and hopefully find one that fits our needs. The website also contains some more useful information such as: guides, descriptions, usage statistics and a support forum. The usage statistics contains some interesting information, like a graph showing the % of known JMeter version installations over time. There is also list of available plugins sorted by the number of known users.
As JMeter plugins are such a powerful tool for building our load tests, let’s take a look at the 10 most popular JMeter plugins and learn how and when to use them.
What are the Top JMeter Plugins?
The top 10 JMeter plugins are:
10th Place: 3 Basic Graphs
The 3 Basic Graphs plugin extends JMeter with three listeners: Active Threads Over Time, Response Times Over Time, and Transactions per Second. These listeners provide you with information and KPIs about your load testing results in a graphic form, enabling you to analyze the success of your performance tests and making it easier to decide on future steps for your website or app.
The plugin can be installed via the Plugins Manager as the “3 Basic Graphs” plugin or as a part of the “jpgc - Standard Set” plugin.
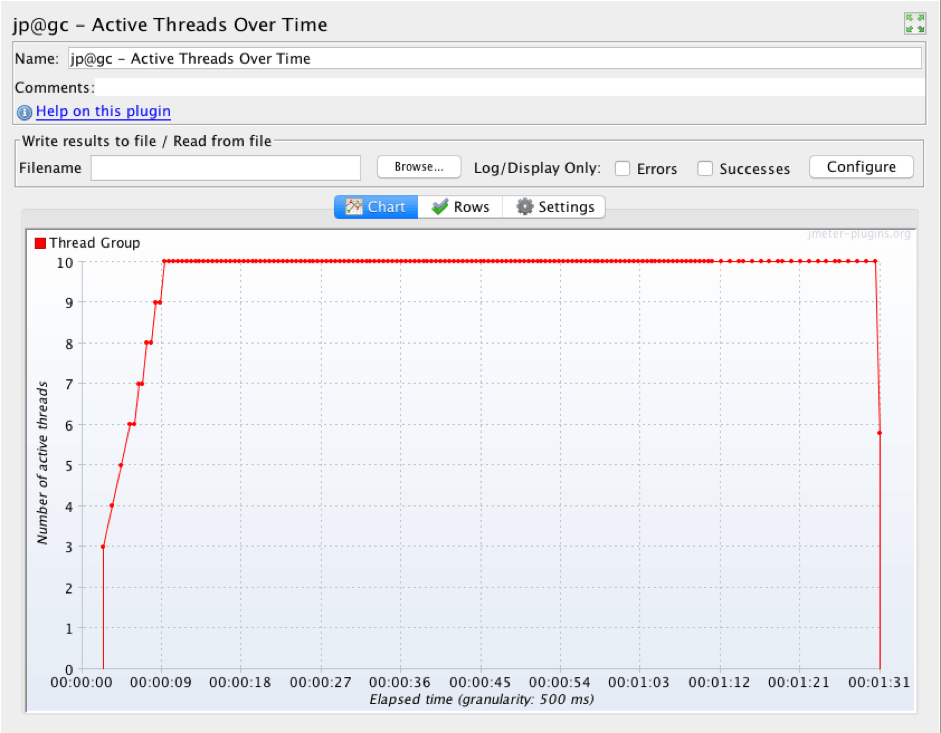
Active Threads Over Time Listener
The Active Threads Over Time listener shows a graph of how many concurrent users are active in each thread group during a test run.
How to find: HTTP Request -> Add -> Listener -> jp@gc - Active Threads Over Time
Example:
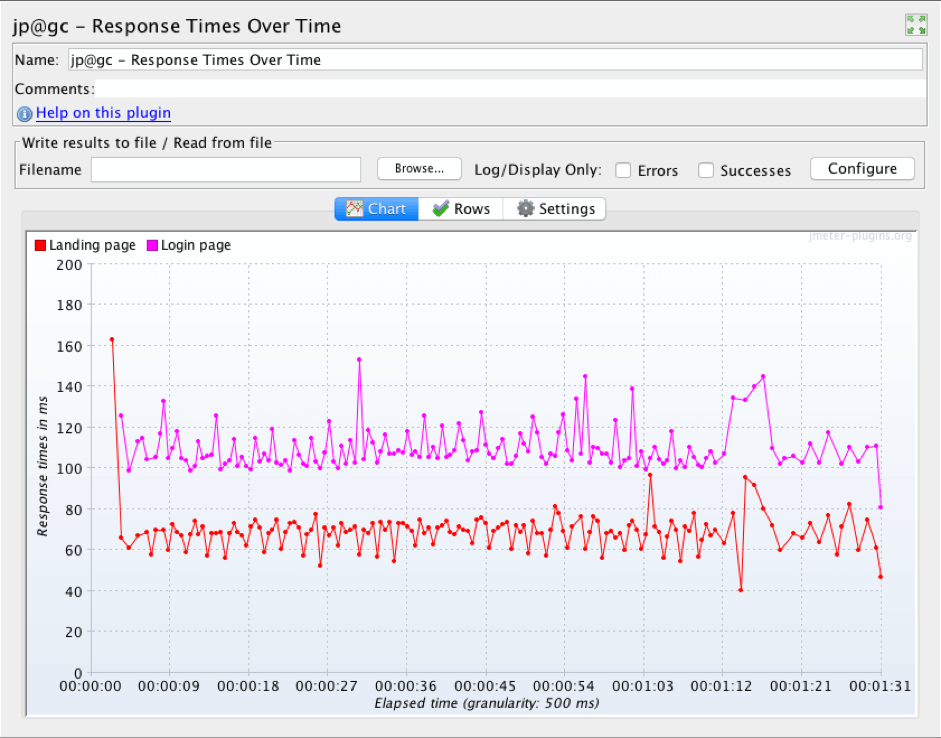
Response Times Over Time Listener
The Response Times Over Time listener shows a graph of the average response time in milliseconds for each sampler during a test run.
How to find: HTTP Request -> Add -> Listener -> jp@gc - Response Times Over Time
Example:
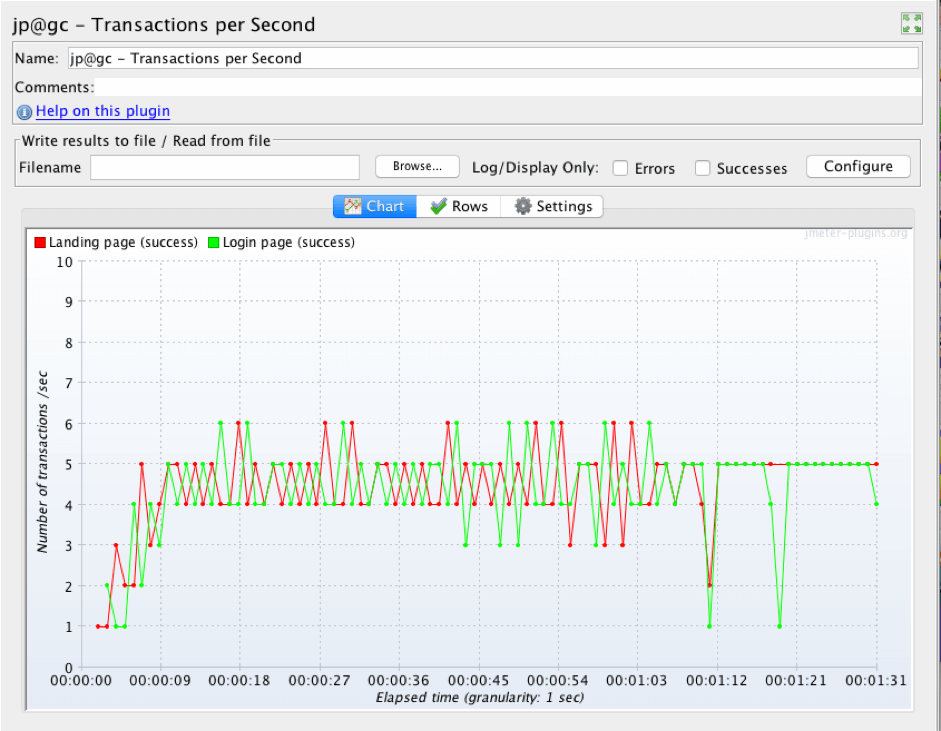
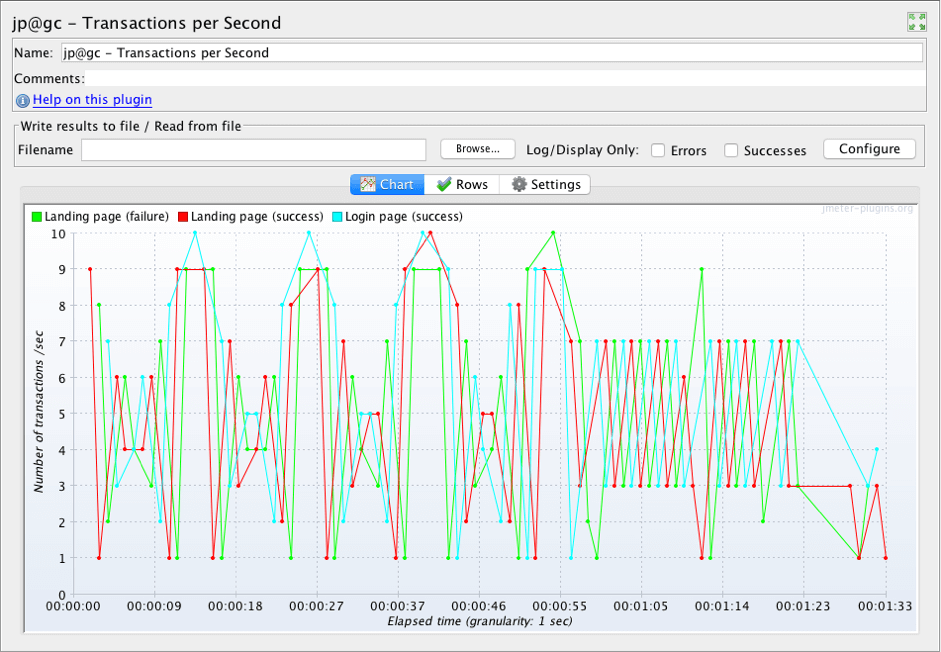
Transactions Per Second Listener
The Transactions per Second listener shows a graph of the number of successful and failed transactions per second for each sampler during a test run. Also it has two types of graphs: a detailed display (one row per sampler) and an aggregated display (all samplers combined).
How to find: HTTP Request -> Add -> Listener -> jp@gc - Transactions per Second
Example:
9th Place: JSON Plugins
Installing the JSON Plugins provides us with one more sampler and two post-processors: the JSON to XML Converter sampler, the JSON Format Post Processor and the JSON Path Extractor. These elements are a set of tools that enable us to work comfortably with data in JSON format.
The Jenkins plugin can be installed via the Plugin Manager as “JSON Plugins”.
JSON to XML Converter
This sampler transforms JSON text into XML format.
How to find: Thread Group-> Add -> Sampler -> jp@gc - JSON to XML Converter
Example:
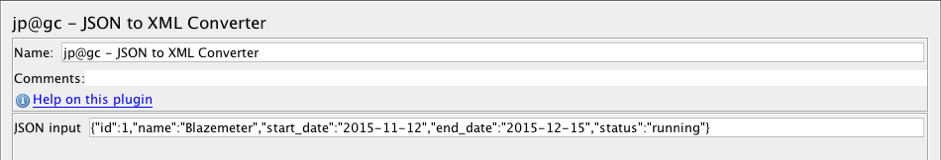
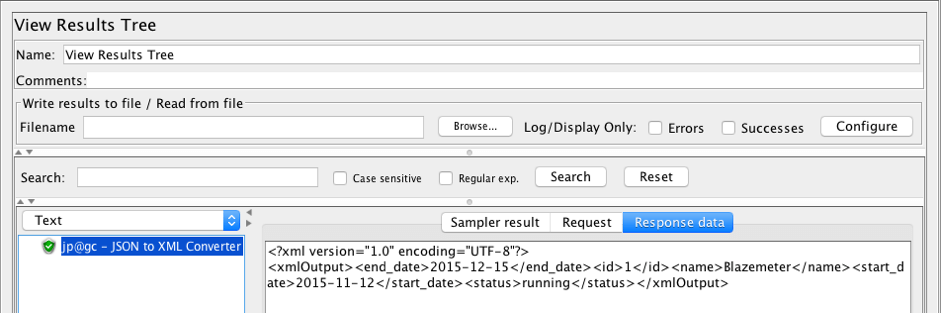
The text entered in the JSON input field will be converted to XML format. We can see the result of the sampler in the screenshot below.
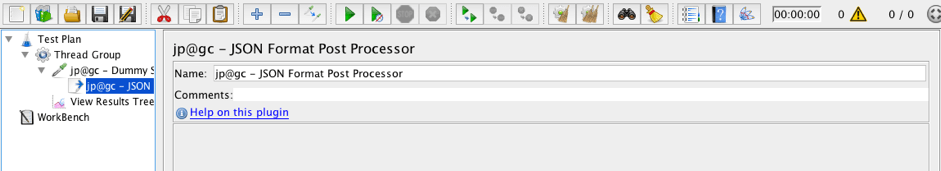
JSON Format Post Processor
This post-processor formats JSON responses and makes them more readable.
How to find: HTTP Request -> Add -> Post Processors -> jp@gc - JSON Format Post Processor
Example:
I have used a Dummy Sampler to emulate a JSON response from the server.
As we can see, the JSON response is displayed in a single line. This wouldn’t be convenient if we had a larger response.
Let’s add the JSON Format Post Processor to this sampler.
Run the script again and see the difference.
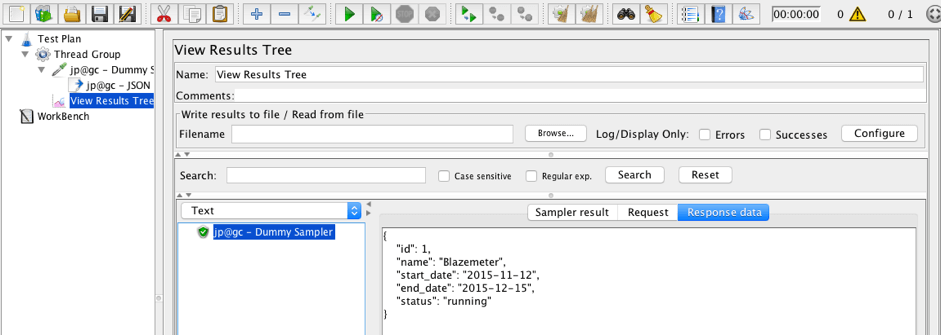
The JSON response is well formatted and very convenient to read.
JSON Path Extractor
The JSON Path Extractor post-processor is designed to extract values from JSON responses using the JSONPath syntax.
How to find: HTTP Request -> Add -> Post Processors -> jp@gc - JSON Path Extractor
Example:
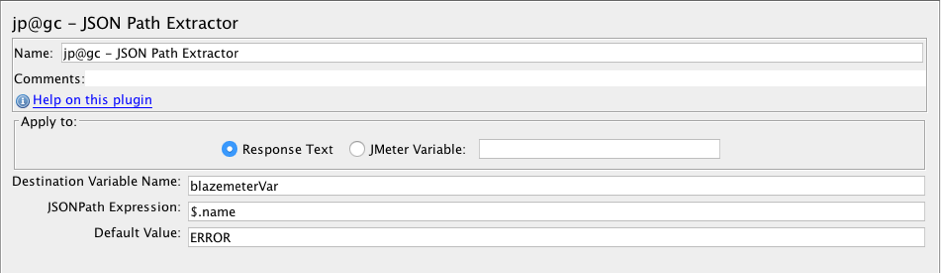
This extractor works similar to the way the XPath Extractor worked. The extracted value will be saved to a variable (“blazemeterVar”). It will use the default value (“ERROR”) if the JSONpath (“$.name”) is not found.
8th Place: Inter-Thread Communication
Installing the “Inter-Thread Communication” JMeter plugin extends JMeter functionality with an Inter-Thread Communication PostProcessor, Inter-Thread Communication PreProcessor, and a number of functions.
Inter-thread communication means that we can put a string value into a queue from one Thread Group, and then get that value in another Thread Group. This feature lets us synchronize separate Thread Groups.
The plugin can be installed via the Plugin Manager as “Inter-Thread Communication” or as a part of the “jpgc - Standard Set” plugin.
Inter-Thread Communication PostProcessor & PreProcessor
How to find:
Test Plan -> Add -> Post Processors -> jp@gc - Inter-Thread Communication PostProcessor
Test Plan -> Add -> Post Processors -> jp@gc - Inter-Thread Communication PreProcessor
Example:
I have created a small script to demonstrate how to use the PostProcessor and PreProcessor. This script contains two Thread Groups. The first Thread Group puts values into the queue. The second Thread Group reads values from the queue.
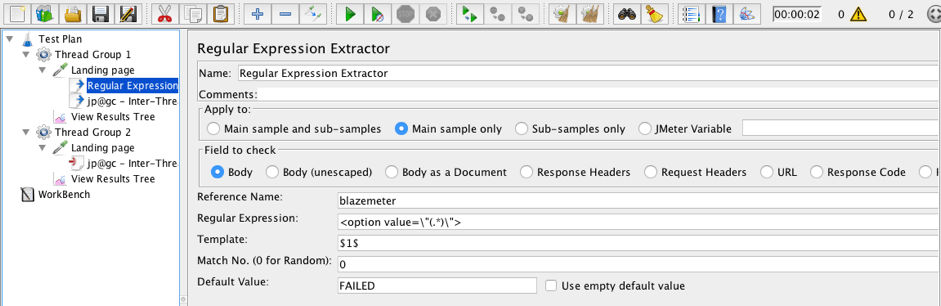
This Regular Expression Extractor extracts the value from the page and puts it into the ‘blazemeter’ variable.
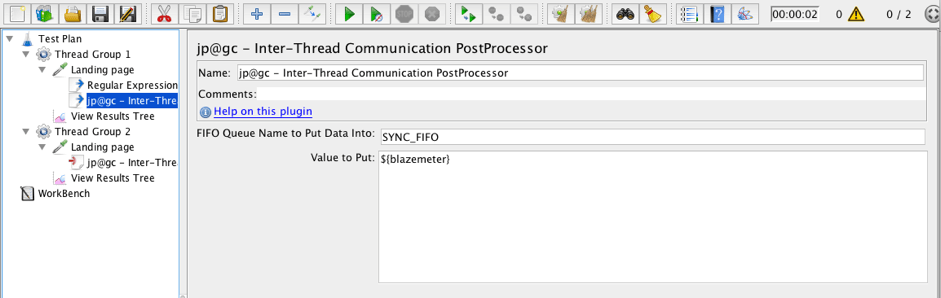
This Inter-Thread Communication PreProcessor puts the value from the variable ‘blazemeter’ into queue with name ‘SYNC_FIFO’.
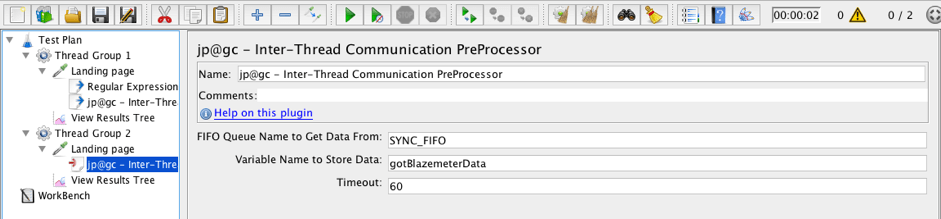
In the second Thread Group Inter-Thread Communication PreProcessor gets values from the ‘SYNC_FIFO’ queue and stores it in the ‘gotBlazemeterData’ variable.
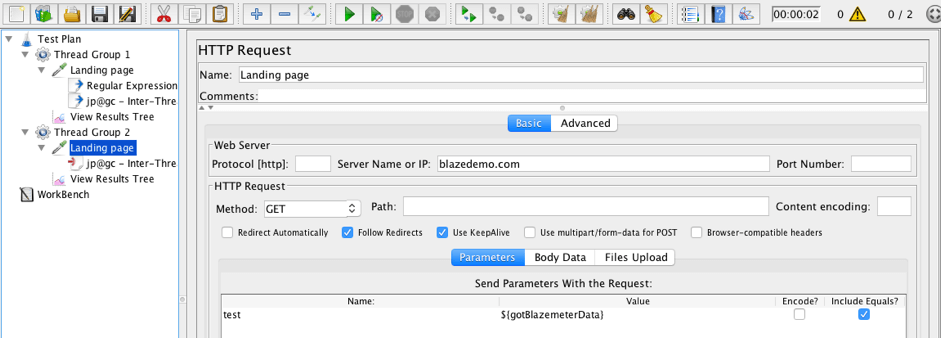
The value of the ‘gotBlazemeterData’ variable can be sent with a request as presented in screenshot above.
Sounds simple and interesting, right?
Functions
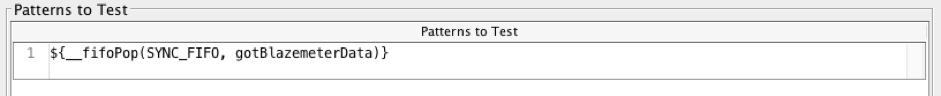
Inter-thread communication also adds four functions to work with queues: fifoPut, fifoGet, fifoPop, fifoSize. These functions can be used anywhere on JMeter where functions would be executable. For example, in the Response Assertion element in the Patterns to Test field, like in the screenshot below.
7th Place: Flexible File Writer
This plugin extends JMeter with the Flexible File Writer listener. This listener is designed to write test results into the file in a flexible format, which we can specify via the JMeter GUI.
The plugin can be installed via the JMeter Plugin Manager as “Flexible File Writer” or as a part of the “jpgc - Standard Set” plugin.
How to find: Test Plan -> Add -> Listener -> jp@gc - Flexible File Writer
Example:
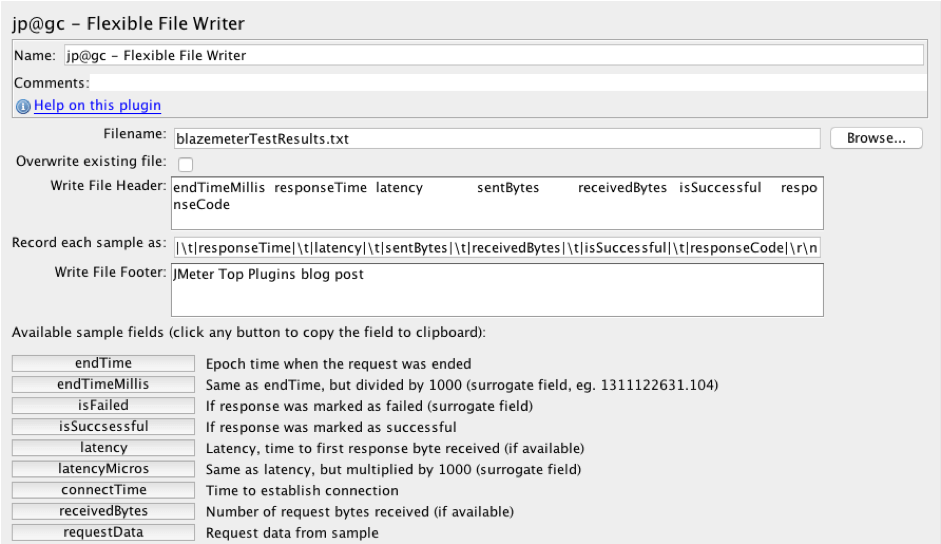
The listener has some options to config the output file which we can see above. By using those options we can change the file header, log content and file footer. By default, the log contains the following values for each run sample: endTimeMillis, responseTime, latency, sentBytes, receivedBytes, isSuccessful and responseCode. By using the ‘Record each sample as’ field, we can change the set of logged values.
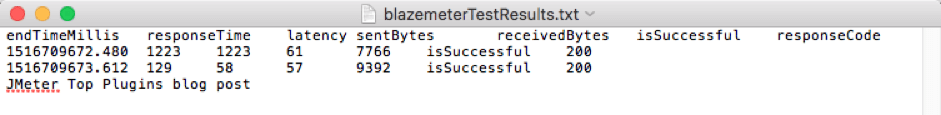
An example of file content can be found below. It contains a header, the log itself and a footer.
6th Place: Custom JMeter Functions
The Custom JMeter Functions plugin extends JMeter’s functionality with a number of useful functions. Here is a list of them:
- chooseRandom: chooses a random value from the list of arguments
- doubleSum: calculates the sum of floating point values
- Env: receives an environment variable value
- isDefined: determines if the variable was already defined
- MD5: computes MD5 hash of string or variable value
- base64Encode: encodes a string or variable value with Base64 algorithm
- base64Decode: decodes a string or variable value from Base64 into string
- strLen: calculates the length of constant string or variable value
- Substring: returns a substring of a particular string
- strReplace: replaces a part of the string with another string
- strReplaceRegex: replaces all the substrings that satisfy the regular expression with the replacement string
- uppercase and lowercase: changes the case of string or variable value
- iterationNum: returns the number of current iteration in thread group
- If: provides if syntax
- caseFormat: provides changing string case format
The plugin can be installed via the Plugin Manager as “Custom JMeter Functions” or as a part of the “jpgc - Standard Set” plugin.
Example:
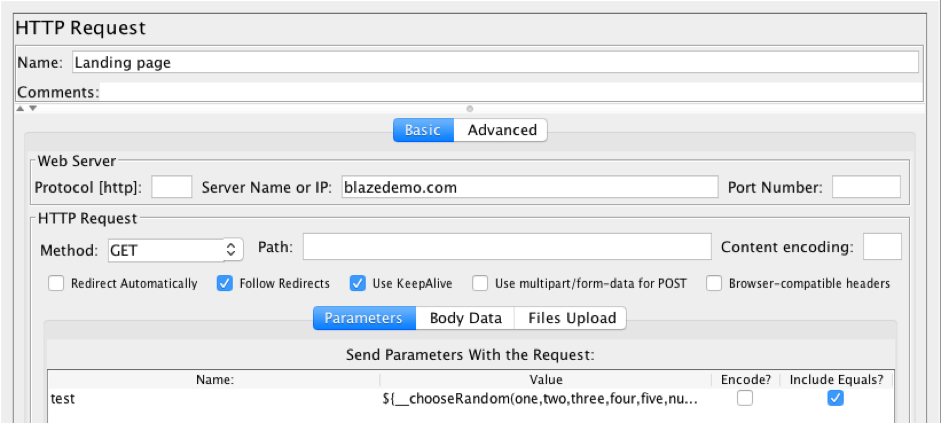
The ‘chooseRandom’ function chooses a random value from the list of its arguments. These functions can be used just like any other JMeter functions.
5th Place: Throughput Shaping Timer
This plugin adds the following functionalities to JMeter: Throughput Shaping Timer, Special Property Processing and Schedule Feedback Function. These elements enable us to limit the test throughput, to ensure we don’t exceed our required throughput value.
The JMeter plugin can be installed via the Plugin Manager as “Throughput Shaping Timer” or as a part of the “jpgc - Standard Set” plugin.
Throughput Shaping Timer
This interesting timer is designed to control requests per second to the server during a test run.
How to find: Thread Group -> Add -> Timer -> jp@gc - Throughput Shaping Timer
Example:

The timer has a schedule table and preview graph. It is a very convenient way to control a load during a test run.
Special Property Processing
This feature gives us the ability to process a JMeter property called ‘load_profile’. This property specifies a load pattern with a set of function-like declarations. Declarations can be of 3 types: const, line and step.
- const(N, T): holds a constant load of N requests per second for T seconds
- line(N, K, T): generates linear increasing of load from N to K requests per second during T seconds
- step(N, K, S, T): generates a stepping load from N requests per second to K requests per second, each step height to will be of S requests per second, each step duration will be T seconds
The main value of this property is that we are able to setup requests per second throughput with the jmeter.properties file or just with the command line when running JMeter.
Example: load_profile=const(20,10s) line(20,100,1m) step(5,15,5,10m)
Schedule Feedback Function
This function enables a feedback loop for the number of threads. The feedback checks if enough threads are running right now. It also provides additional threads when the requests per second schedule is not achieved during test runs.
For example, we started a test with 20 threads. They generate only 100 requests per second. But we have a 150 request per second throughput. So the feedback function checks that we need 50 more requests per second, and starts another 10 threads.
Example: ${__tstFeedback(blazemeter-name,1,1000,40)}
‘blazemeter-name’ is the name of the Throughput Shaping Timer to integrate with. 1 is the number of starting threads. 1000 is the number of max allowed threads. 40 is the number of spare threads to keep in the thread pool. So this function will increase the number of threads up to 1000 threads, if the requests per second schedule is not be met during the test run.
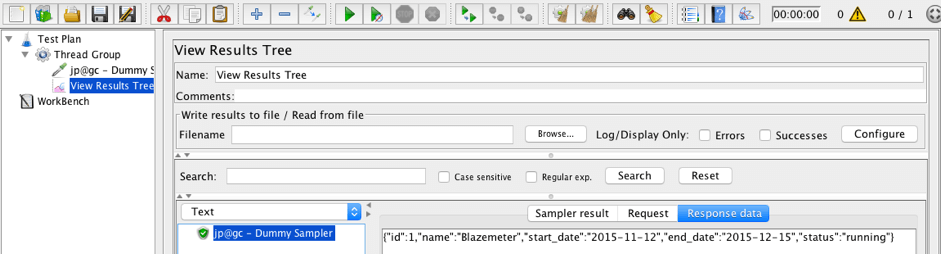
4th Place: Dummy Sampler
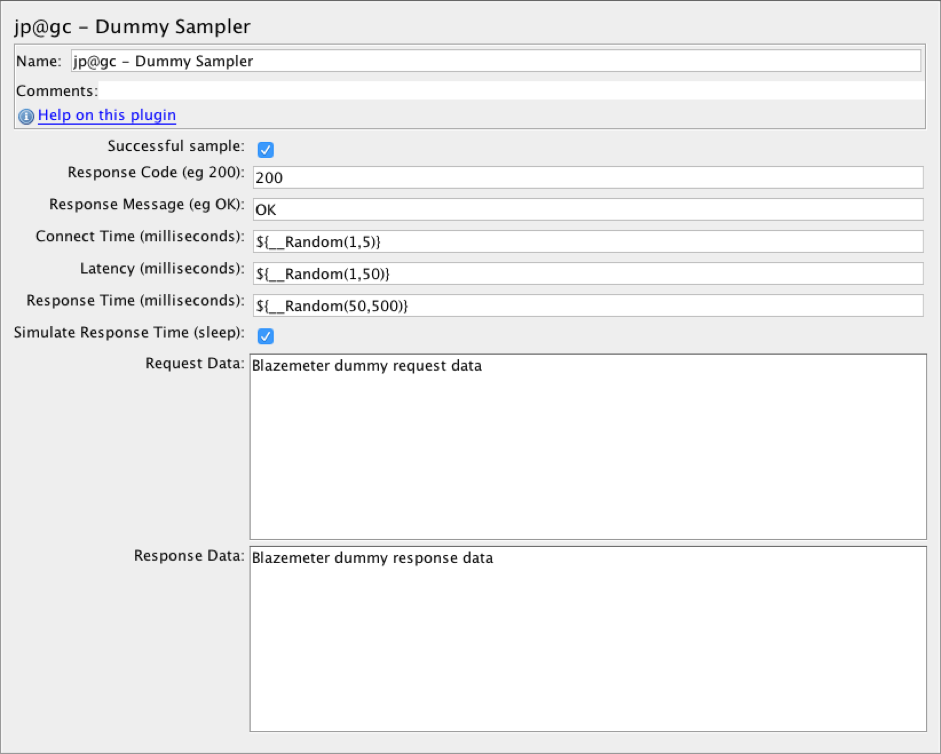
The Dummy Sampler emulates the work of requests and responses without actually running the requests. Request and response data are defined in the sampler’s fields. This is a very convenient way to debug post-processors and extractors.
The plugin can be installed via the JMeter Plugin Manager as “Dummy Sampler” or as a part of the “jpgc - Standard Set” plugin
How to find: Thread Group -> Add -> Sampler -> jp@gc - Dummy Sampler
Example:
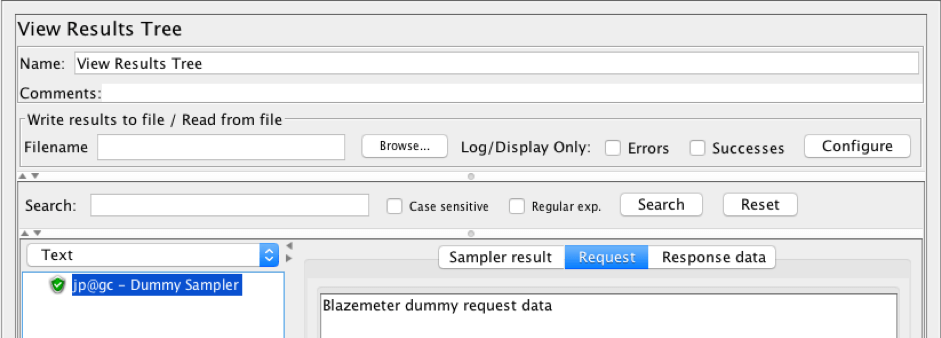
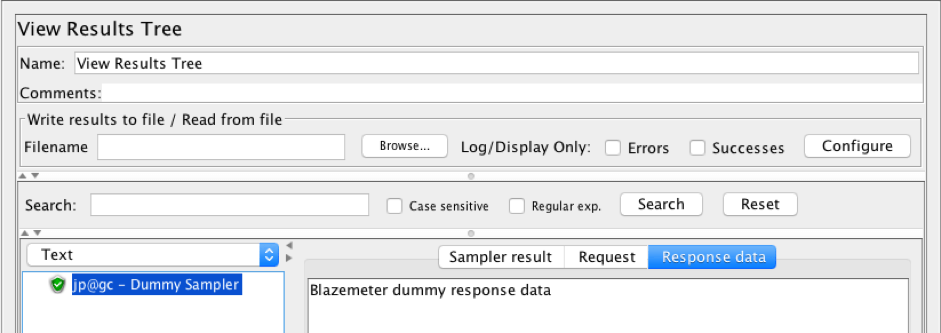
Here is what the results of the Dummy sampler will look like after it is run in the View Results Tree listener.
Request tab:
Response tab:
3rd Place: Custom Thread Groups
The Custom Thread Groups JMeter plugin adds five thread group types: Stepping Thread Group, Ultimate Thread Group, Concurrency Thread Group, Arrivals Thread Group and Free-Form Arrivals Thread Group. These five thread groups open huge possibilities to create required schedules for test runs.
The plugin can be installed via the Plugin Manager as “Custom Thread Groups” or as a part of the “jpgc - Standard Set” plugin.
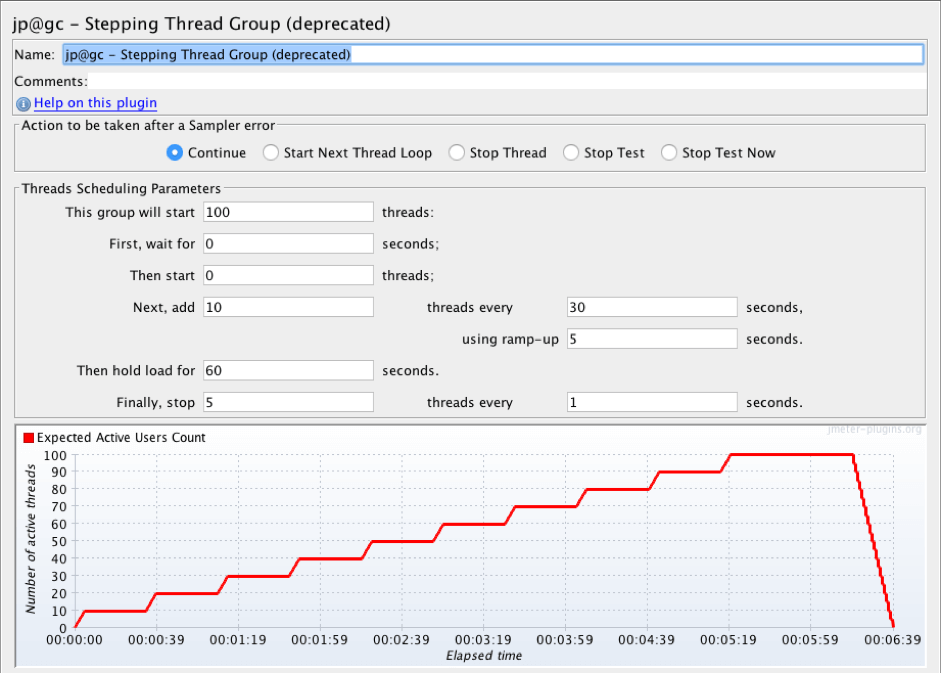
Stepping Thread Group
The Stepping Thread Group adds a convenient way to create non-linear thread scheduling. Quite often, the scheduling scenario is in the form of ‘stairs’ (see below).
How to find: Test plan -> Add -> Threads (Users) -> jp@gc - Stepping Thread Group (deprecated)
Example:
You can read more information about the Stepping Thread Group from this blog post.
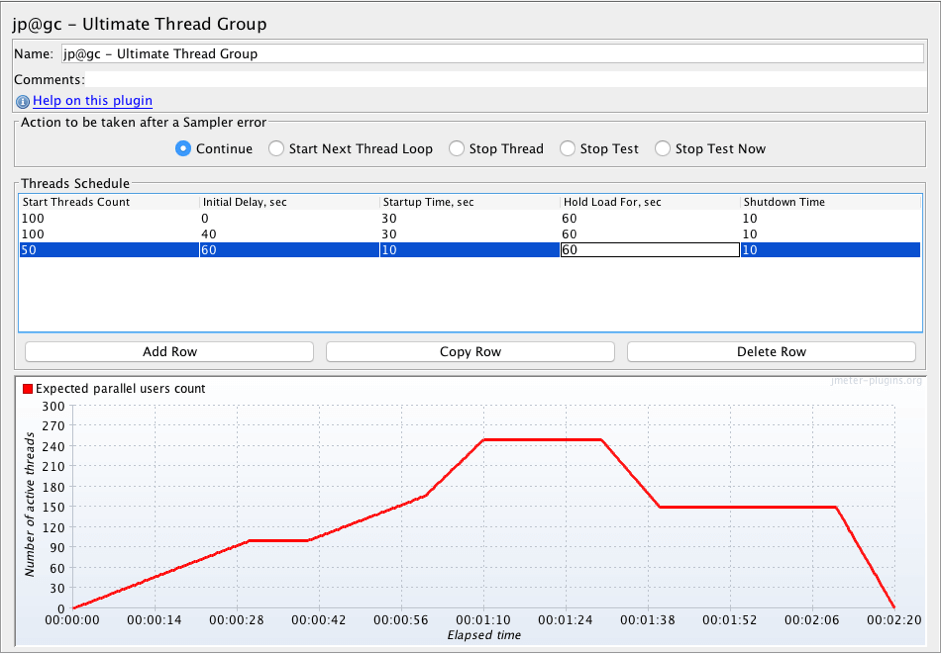
Ultimate Thread Group
The Ultimate Thread Group is designed to add flexible thread scheduling to your test scenario. It allows us to create a schedule with almost any configuration, in the Threads Schedule table.
How to find: Test plan -> Add -> Threads (Users) -> jp@gc - Ultimate Thread Group
Example:
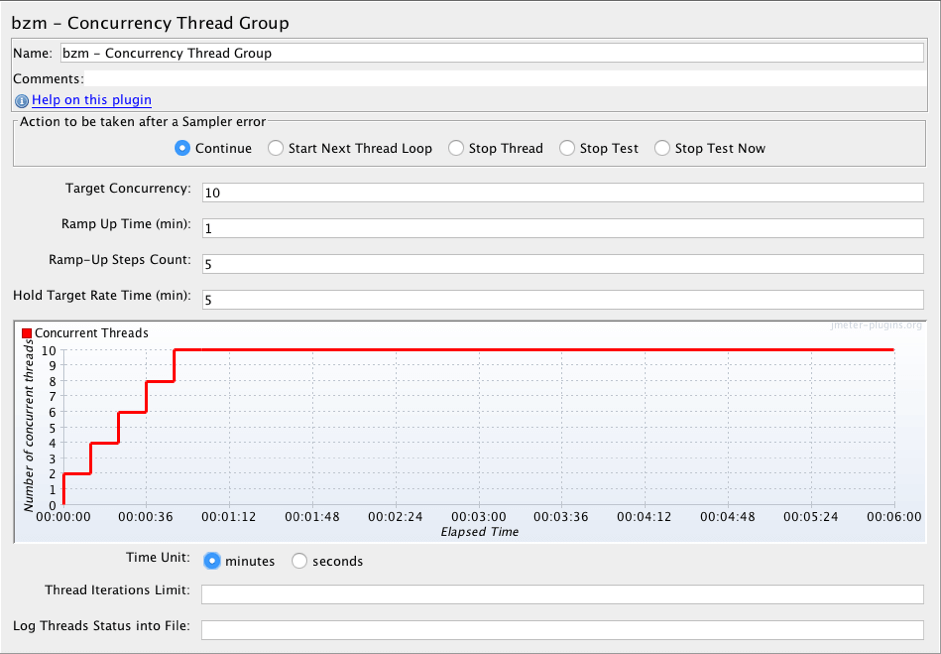
Concurrency Thread Group
The Concurrency Thread Group allows us to configure a stepping threads schedule in a simple way. It works similar to the Stepping Thread Group and is a great replacement for it, especially if the Stepping Thread Group is removed in future versions.
How to find: Test plan -> Add -> Threads (Users) -> bzm - Concurrency Thread Group
Example:
You can find more information about the Concurrency Thread Group here in this BlazeMeter blog.
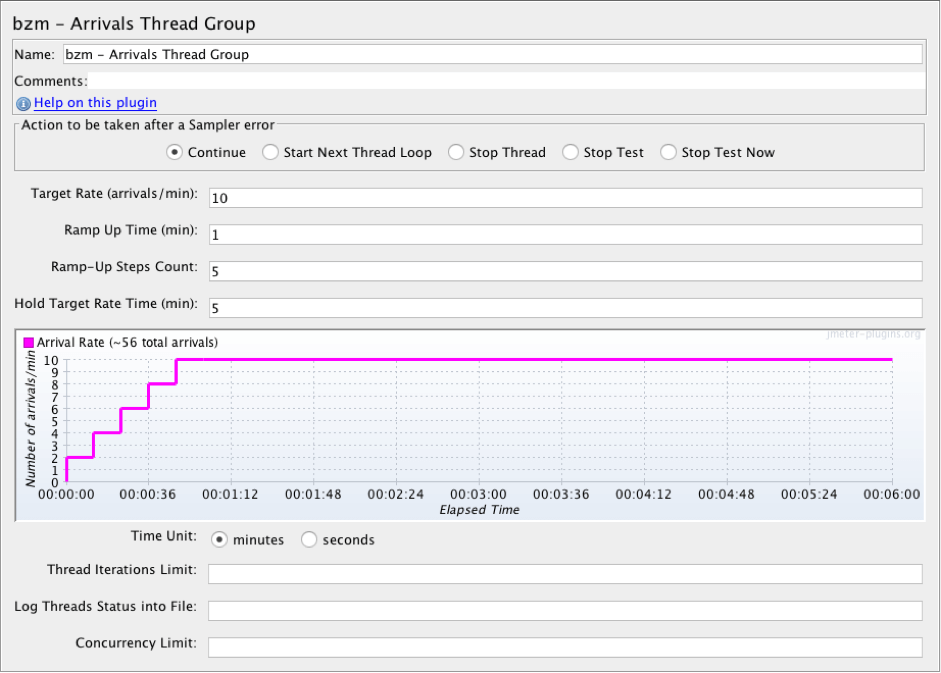
Arrivals Thread Group
The Arrivals Thread Group works with a thread iteration start schedule as a way to describe/determine the load. "Arrival" means the start of the thread iteration.
How to find: Test plan -> Add -> Threads (Users) -> bzm - Arrivals Thread Group
Example:
Free-Form Arrivals Thread Group
The Free-Form Arrivals Thread Group works with the "arrival" schedule as a way to describe the load. "Arrival" means the start of thread iteration. This element allows us to create a flexible schedule.
How to find: Test plan -> Add -> Threads (Users) -> bzm - Free-Form Arrivals Thread Group
Example: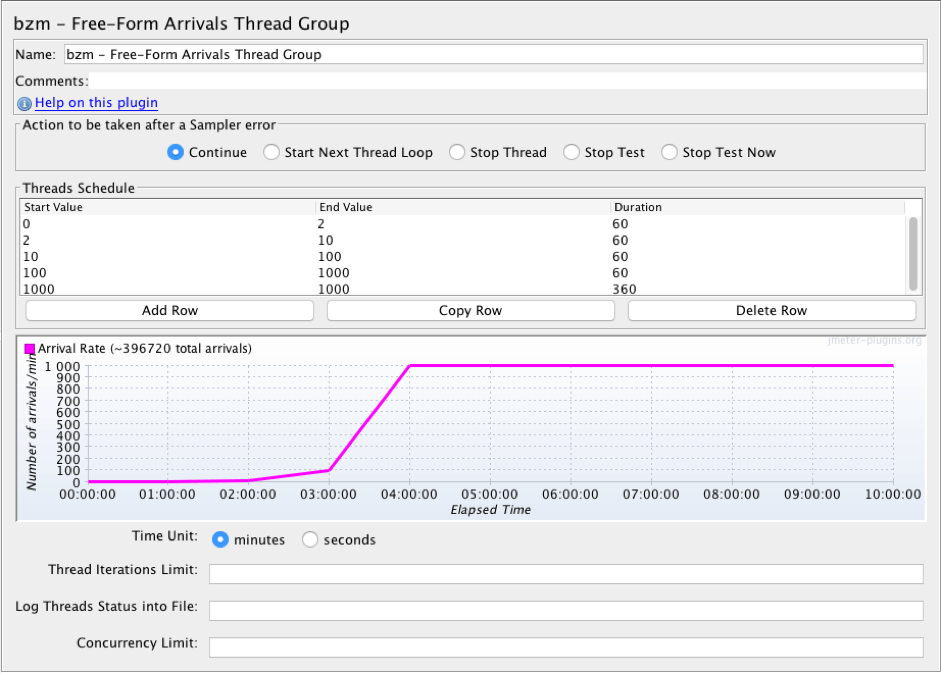
The values here are the number of started iterations per minute. An iteration is one loop of script run.
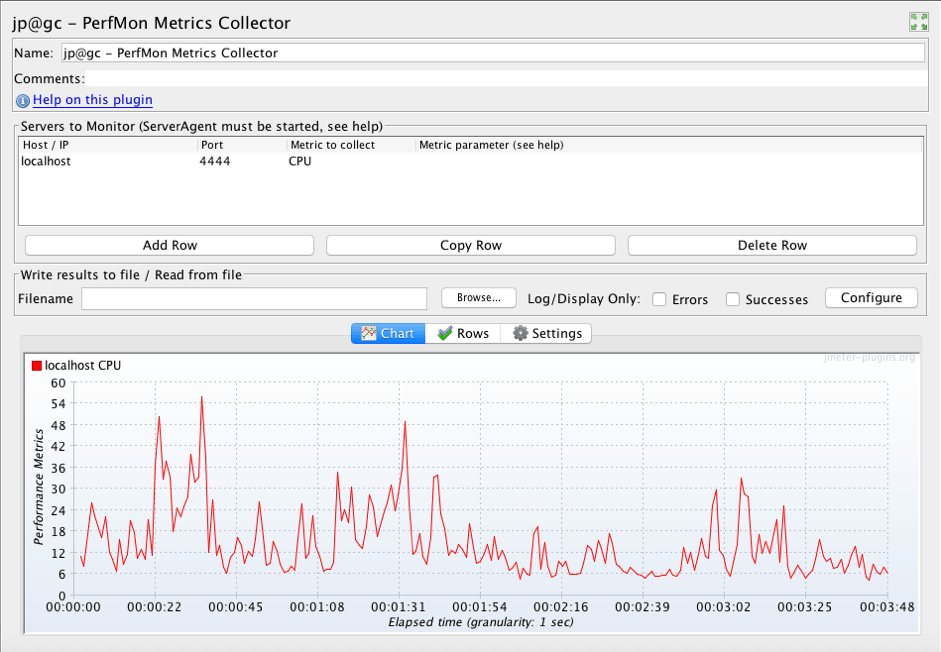
2nd Place: PerfMon Servers Performance Monitoring
This plugin extends JMeter with the PerfMon Servers Performance Monitoring listener. This listener allows us to monitor CPU, Memory, Swap, Disks I/O and Networks I/O of the servers loaded.
The plugin can be installed via the Plugin Manager as “PerfMon (Servers Performance Monitoring)” or as a part of the “jpgc - Standard Set” plugin.
How to find: Test plan -> Add -> Listener -> jp@gc - PerfMon Metrics Collector
Example:
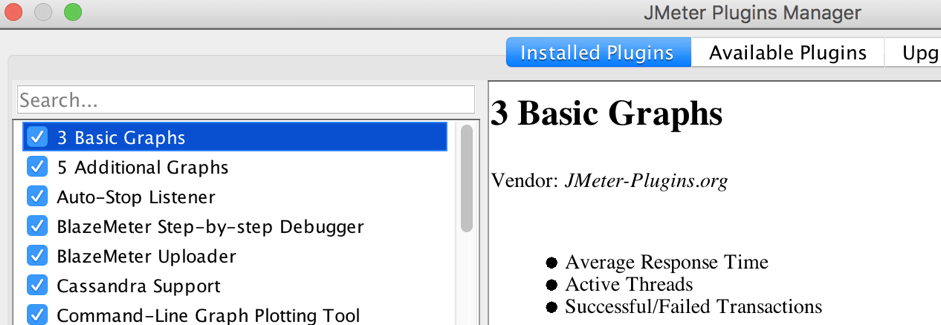
1st Place: Plugins Manager
The most popular plugin is the Plugins Manager, and for good reason. Usually, a user needs to install the Plugin Manager before installing other plugins. The Plugins Manager is the most convenient way to manage JMeter plugins.
The Plugin Manager has 3 main tabs: Installed plugins, Available plugins and Upgrades.
How to find: Options -> Plugins Manager
Example:
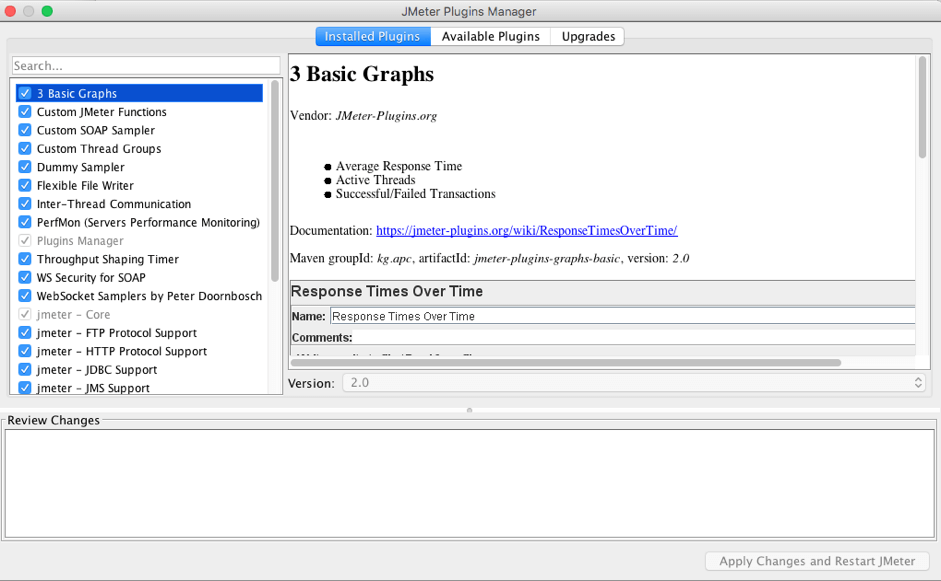
The installed plugins tab contains a list of installed plugins, a description area on the left, and a review changes area at the bottom.
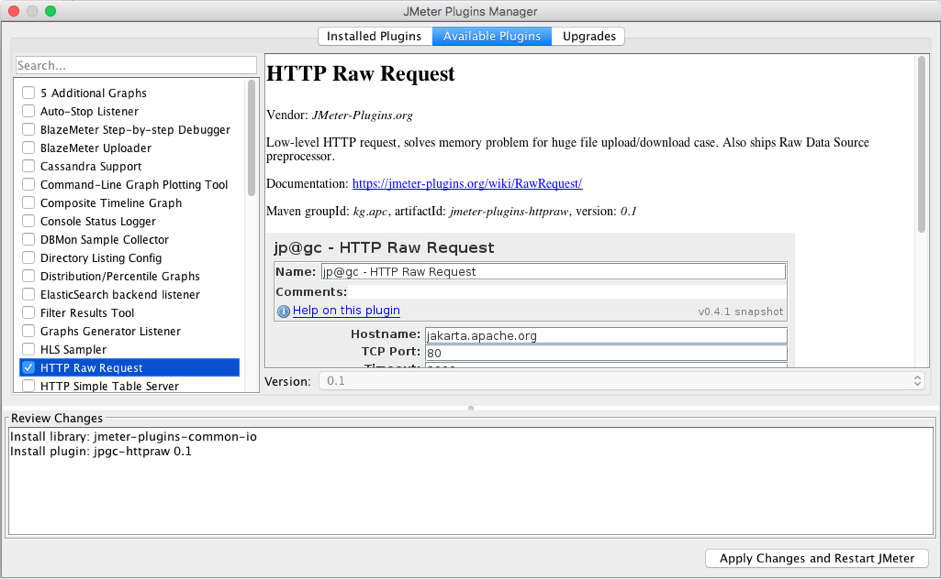
The available plugins tab contains a list of available plugins, a description area on the left and a review changes area at the bottom. Use the search to find all the plugins to fit your needs!
Bottom Line
That’s it! We took a look at the top 10 JMeter plugins (plus we have written more about others, such as JMeterPluginsCMD and Redis). I hope it was informative and gives you some ideas for extending JMeter's capabilities.
To learn more advanced JMeter, check out BlazeMeter University.
Try our BlazeMeter, which enhances JMeter’s features:
- Simple Scalability – It’s easy to create large-scale JMeter tests. You can run far larger loads far more easily with BlazeMeter than you could with an in-house lab.
- Rapid-Start Deployment – BlazeMeter’s recorder helps you get started with JMeter right away, and BlazeMeter also provides complete tutorials and tips.
- Web-Based Interactive Reports – You can easily share results across distributed teams and overcome the limitations of JMeter’s standalone UI.
- Built-In Intelligence – The BlazeMeter Cloud provides on-demand geographic distribution of load generation, including built-in CDN-aware testing.