Blog
December 18, 2024
Load UI: A Step-by-Step Guide to UI Load Testing

Performance Testing,
Functional Testing
An excellent UI design is one of the most impactful ways to attract and sustain users to your application. A UI that stands out should be comprised of a few things: visually compelling aesthetic, great overall design, and seamless functionality.
On the flip side, a UI that does not have those hallmarks is a UI that will repel potential users. And what does having fewer and fewer users mean? A gut-wrenching loss to overall organizational revenue.
This is where UI load testing comes in. UI load testing is a type of performance test that puts every aspect of your app under strain to ensure it can hold up to whatever the world throws at it.
So, if your question is if you should do load UI testing, the answer is yes. This blog offers everything you need to know to get started with UI load testing with JMeter and BlazeMeter.
What Is UI Load Testing?
UI load testing refers to testing everything that is visible to users under the expected usage of multiple users.
Performance Testing vs. UI Load Testing
In brief, performance testing (such as load or stress testing) focuses on testing backend systems. In other words, they test if all server-side components behind the scenes (i.e. your application server, database, load balancer, etc.) can hold up under pressure while tens or hundreds of thousands of users are hitting it at once. Testers will often rely on tools such as JMeter or BlazeMeter to simulate such loads.
Meanwhile, UI testing focuses solely on the frontend. Instead of testing backend performance while many users are hitting your application at once, you want to test a single user’s experience with the GUI by simulating a user’s journey via a web browser, click by click. This is usually done through a UI test automation tool like Selenium.
Many testers over the years have asked me an interesting question, though: What if you need to load test your UI?
See why enterprise organizations like yours choose BlazeMeter for performance testing. Download the eBook today >>
Back to topWhy UI Load Testing?
The Problem: Load Testing Selenium
Your first thought might quite reasonably be “Why not just run a Selenium test with X number of users?” In theory, that makes sense, but in praxis, it’s likely not going to end well.
JMeter is well suited for load testing because each “user” is simply a single thread. You can get away with running quite a high volume of simultaneous threads as long as you have the hardware for it. However, this is not true of Selenium. In order to run an automated UI test in Selenium, you need a web browser open in which to interact with said UI. This does not scale well at all because each user needs their own web browser instance. Web browsers are notoriously high resource consumers. Many simultaneous browser instances will quickly consume your available CPU.
You can test this idea yourself very easily: Imagine 500 users using your computer’s web browser all at once. Mind you, that’s not 500 browser tabs; that’s 500 browser instances (500 full windows). You’ll likely find that your computer will freeze up very quickly.
This is why you cannot simply make a decision to run a UI test script with a high volume of users. You’re going to run out of memory very, very quickly. Even BlazeMeter’s cloud engines have a finite amount of hardware resources per engine, which is why if you ever try to get away with running a 500-user Selenium test on BlazeMeter, a support engineer will likely point you to this knowledge base article on why you really shouldn’t do that.
I should mention that there’s a bit of an older JMeter plugin that tries to make this work, namely the JMeter WebDriver plugin. While it’s very handy to be able to embed a Selenium script within a JMeter script, it doesn’t resolve the core problem; each Selenium user still requires their own memory-hogging browser. For this reason, BlazeMeter no longer supports this plugin.
So, is that it? Are you left with no solution? Far from it! Thankfully, BlazeMeter provides a set of tools to not only achieve the desired result, but to do so with much more efficient resource usage.
The Solution: BlazeMeter EUX Monitoring
Since the goal is to assess how the UI holds up for a user while the backend is under load, you don’t need to run a bunch of Selenium users to replicate such a scenario. Instead, you can run a single-user Selenium script while a JMeter script runs a load test simultaneously.
In other words, create the load via a bunch of JMeter threads, then test the UI via a single Selenium user (and thus one web browser). BlazeMeter’s End User Experience (EUX) Monitoring does exactly that.
Back to topHow to UI Load Testing with JMeter and BlazeMeter
Now we will go through how to use it.
Create the Scripts
BlazeMeter’s Chrome Extension will conveniently record our JMeter and Selenium scripts simultaneously, meaning we only need to record once.
We’re going to use our favorite fake site, https://blazedemo.com/, to test our scripts against. I’ll fire up the extension, name my script-to-be, and start recording:
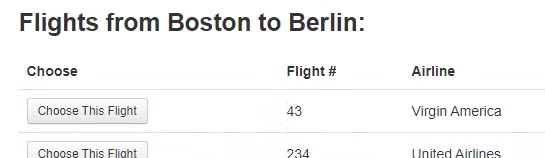
First, go to the URL, then choose your departure and destination, followed by a click of the “Find Flights” button:

On the next page, let’s choose the first option, Virgin America:
Fill out the form on the next page. Remember, it’s a fake form, so don’t take it seriously:
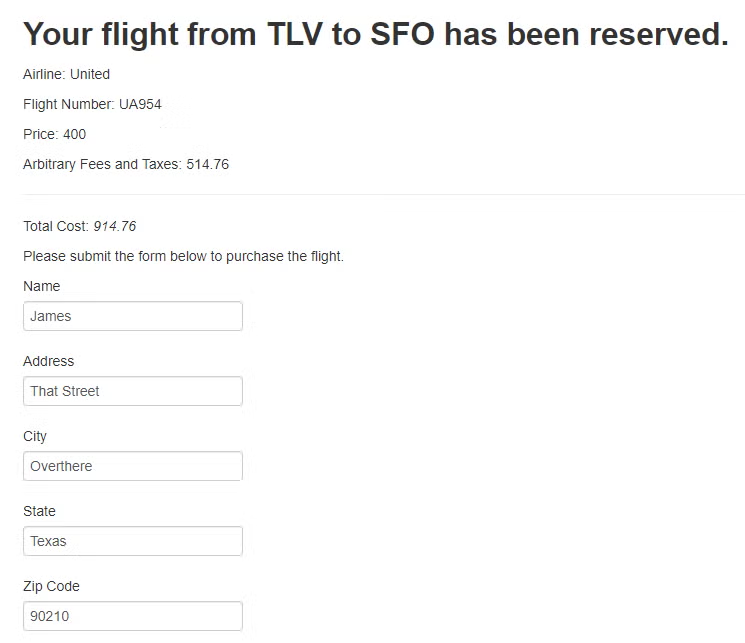
Click “Purchase Flight”, then stop recording.
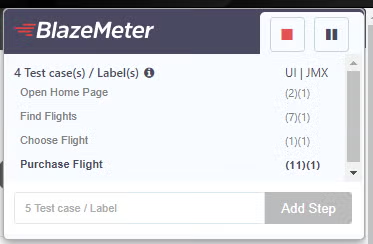
A quick tip: If you simply record, perform the actions, then stop the recording, everything you did will be captured as one big step/label. I personally prefer to break each action up into a separate step/label via the “Add Step” button, then name each step myself:  You don’t have to do this, but I find that it makes the resulting script easier to read afterward because it adds some visual organization that’s easier on human eyes. Notice how you can see the visual separation in the resulting JMeter script: 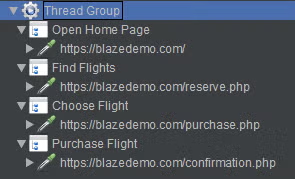 And likewise in the Selenium script: 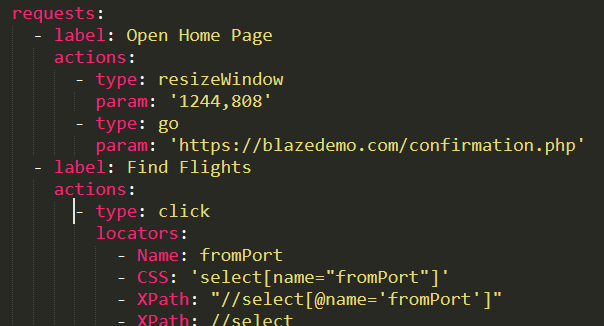 |
Exporting the Scripts
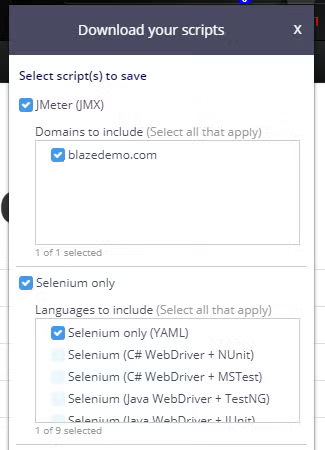
Click “Download” from the Chrome Extension, then export the recording by checking both the JMeter and Selenium boxes. Check the “blazedemo.com” box to include the domain in the JMeter script, and the “Selenium only (YAML)” box to export the Selenium test as a YAML (Taurus) script:
Your JMeter and Selenium scripts are ready to roll. The JMeter script will do the heavy lifting, performance testing the backend, while the Selenium script will test the UI.
The BlazeMeter Test with EUX
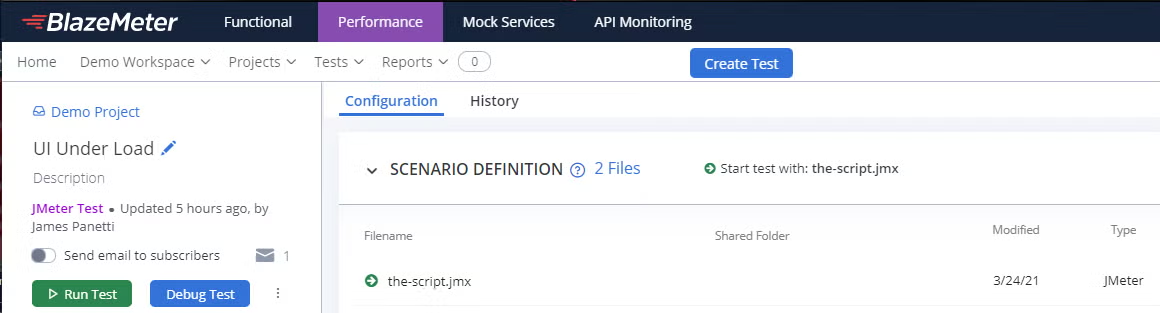
Create a new performance test in BlazeMeter and upload your newly recorded JMeter script to it:
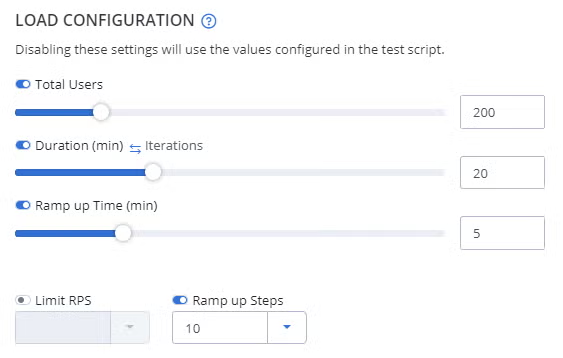
Next, configure your load. I’m going to run 200 users for twenty minutes and I’m going to ramp those users up via ten steps over five minutes:
I’ll stick to one engine for the purpose of my demo here:
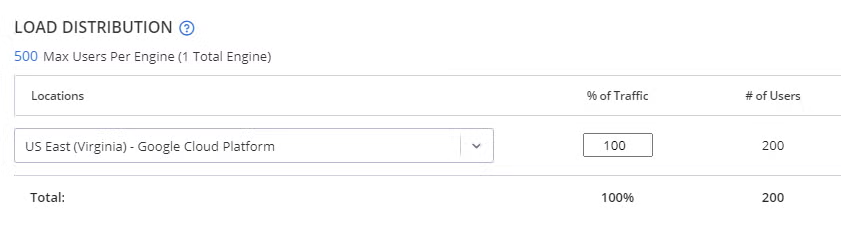
If you already have a JMeter script ready to test your backend under load, your first step is to simply create a typical BlazeMeter performance test, like you would with any other JMeter script.Configure how many users over how long a duration will be hitting your application, then configure how many engines you want that load coming from.
Now for the magic sauce! Let’s enable End User Experience Monitoring by toggling its button on:
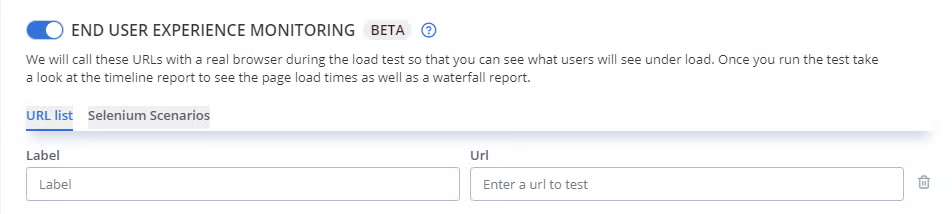
The first thing you’ll notice is that it defaults to a URL list. This is the easiest, script-free way to run a UI test; all you have to do is type in a list of URLs to hit. We just created a Selenium YAML, though, so let’s click the “Selenium Scenarios” tab:
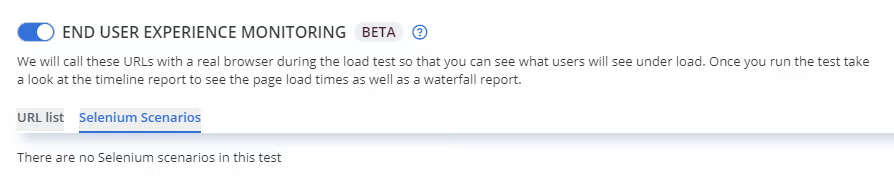
Of course, as the message states, there are no scenarios yet. Let’s give it one by uploading our newly-minted Selenium YAML to the test to join its JMeter partner:
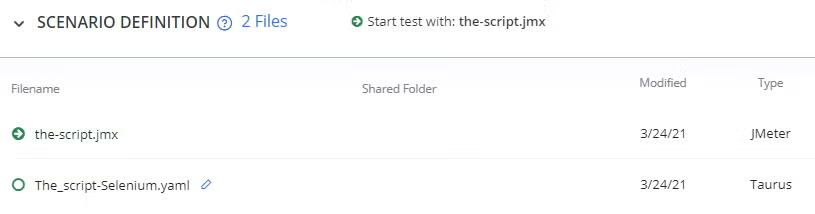
Sure enough, our new script appears as an option, so check to enable it:

Now name your BlazeMeter test and run it:
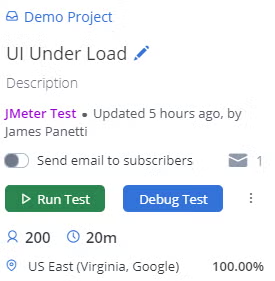
When your performance test kicks off however many engines it needs, your automated UI test will run via one single engine. (A side note: Remember this when counting how many engines you’ll need. With EUX enabled, the count will be however many engines you configured for the performance test + 1 UI test engine.)
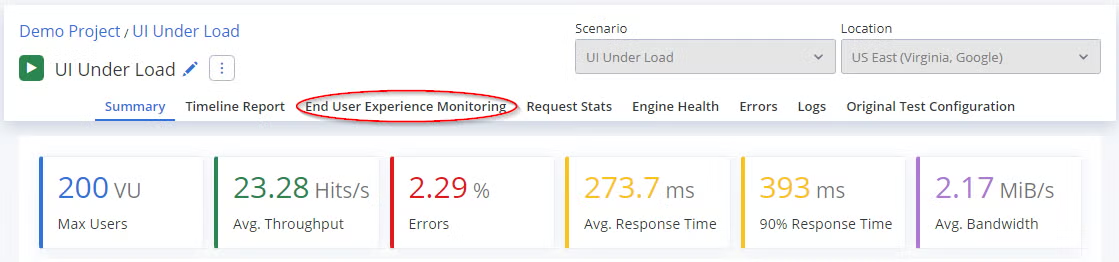
The Report
You’ll find a new End User Experience Monitoring tab in your report. This report will begin displaying live results pretty quickly. After the test finishes, you’ll have a full UI test report that shows how your frontend held up while the backend was under load.
The automated EUX test runs on loop for the entire duration of the performance test, so the report will allow you to compare how the UI behaved at different points in time.
The first thing you’ll see are bar graphs representing how your UI performed during the Selenium test at each point in time throughout the JMeter test’s duration:
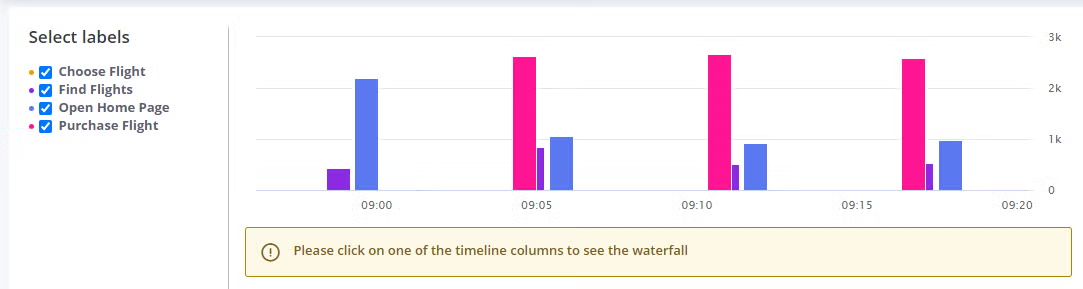
| Note: See the “Select labels” option on the left? This is why I opted to break my actions into different steps/labels during recording. Had I not done so, you would only see one label here. |
Click any of the individual columns along the timeline to see a waterfall report, which includes some handy screenshots. This is especially helpful when troubleshooting any issues with the test afterward.
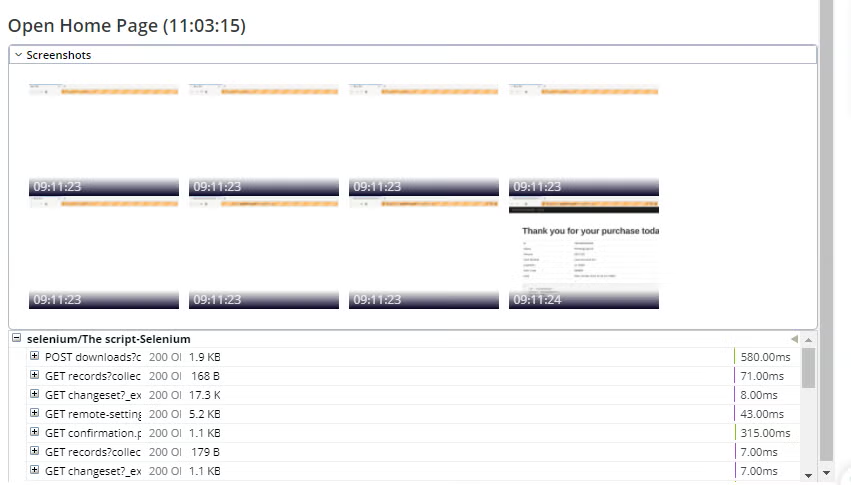
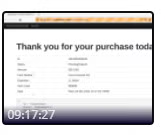
BlazeMeter shows multiple time-stamped screenshots taken of progress made in the browser as it performed each step. Simply click any screenshot to take a closer look. (This is especially handy when troubleshooting any UI issues you may find with your application.)
Click any single screenshot to blow it up for a clearer view:
The section below the screenshots displays a waterfall report full of performance data for each action performed by the script:
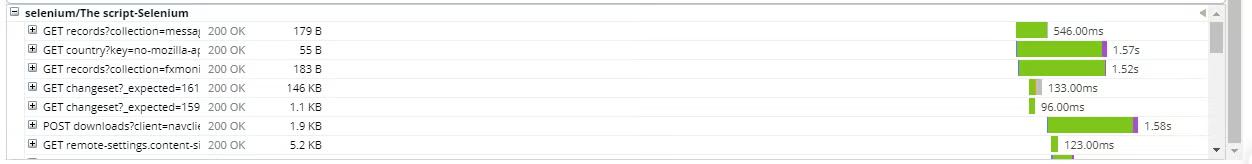
Simply click the “+” beside any single light to see additional details.
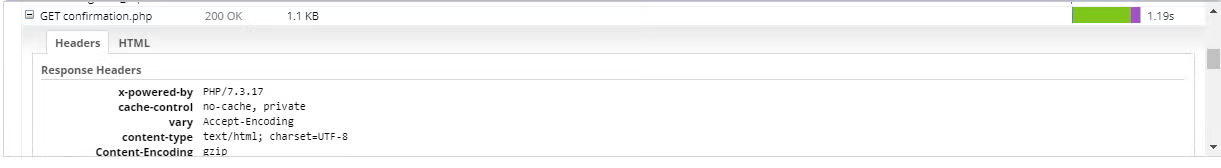
This allows you to review which components of a page may have loaded slower than others.
Back to topBottom Line
Creating a heavy user load with a UI test automation tool such as Selenium is extremely resource-inefficient and will grind most machines to a screeching halt. Thankfully, it’s also not necessary; one can achieve the desired result by creating load via JMeter, then testing the UI via a single Selenium user.
Utilizing EUX Monitoring does just that and saves you precious resources. Load test with JMeter and UI test with Selenium simultaneously, all made easier with the magic of a Taurus YAML file.
BlazeMeter provides this and more. Automate your EUX test by running it alongside your JMeter performance test via the EUX feature. Once your test completes, the test report will provide a wealth of information about how your UI performed while the application was under load.