Blog
January 7, 2020

IBM MQ is a message-oriented middleware (MOM) infrastructure that accelerates the integration of applications and business data across multiple systems. While there are many high-level guides for working with IBM MQ, there are no tutorials with the exact configurations about running an Apache JMeter™ performance test on IBM MQ systems. This IBM MQ tutorial will explain how to run a JMeter load test on IBM MQ with Groovy, and how to produce and consume messages to and from an IBM MQ queue.
Back to topWhat is IBM MQ?
IBM® MQ, also known as WMQ, uses message queues to facilitate the exchange of information, and offers a single messaging Application Programming Interface (API) that insulates the application developer from the details of the various operating systems and network interfaces.
📕 Related Resource: Learn more about How to Test IBM MQ Docker
The MOM infrastructure model is made of the following components:
- Provider - The provider, aka the broker, is the router responsible for buffering and delivering messages. This is the IBM MQ service itself and what I refer to in this blog post as ‘IBM MQ’.
- Client - The client can be any enterprise application component that either produces or consumes messages from the provider. The 'client' is actually a generic term used to denote both consumer/subscriber and producer/publisher. A system can have many clients.
- Message - These are objects created by the producer and received by the consumer. The middleware responsible for sending and receiving the messages is the provider. A message comprises of three parts, a header, properties and the body.
- Queues - The elements where the messages are stored. Messages arrive in the queue when a producer places them in. Messages stay in the queue until the time they are processed by a consumer. A queue can reside in memory or disk storage. Messages are transferred through channels.
Preparing for Your IBM MQ Load Test
First, we need the connection parameters for the IBM MQ under test. Then, if you want to, you can use the IBM MQ UI to validate the queue status when running your JMeter test.
The connection parameters for IBM MQ are:
- “host name” - the name of the IBM MQ server
- “service port” - the connection port
- “channel name” - the element used to transfer messages between queues
- “queue manager name” - the name of the element (it’s a logical entity) that handles the connection with the tested queue
- “queue name” - the specific queue we are testing, our target of message exchanging
- “userid” and “password” needed to open the connection
There are two ways to launch the navigation UI:
1. Use the “IBM MQ Explorer”. The installation package can be found at this link. This is the GUI for the complete enterprise suite for a customer who needs to administer multiple IBM MQ servers from one UI.
2. Use the “IBM MQ Console”. This is a light version that can be reached from your browser. Typically the URL is https://:9443/ibmmq/console/. This module can be removed from the IBM MQ installation so check with your system administrator in case of its absence.
For the scope of this paper, the “IBM MQ Console” is suitable and provides all the information required to understand if our JMeter script works well. This is what it looks like:
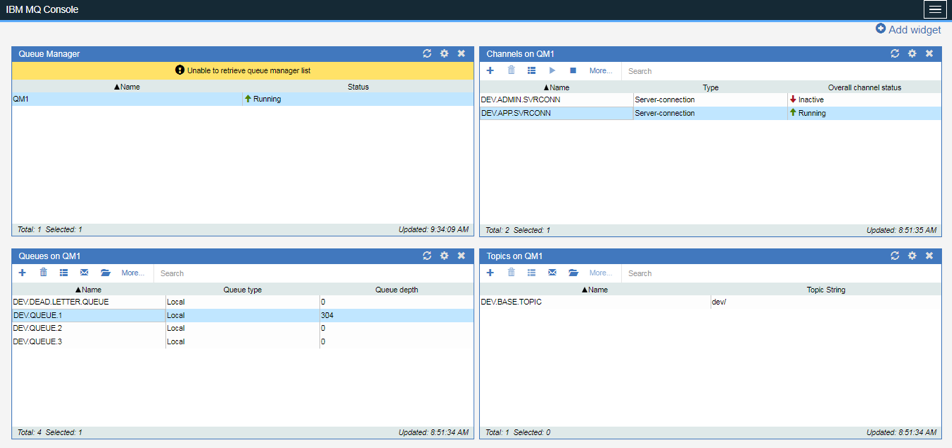
As you can see, the IBM MQ console enables monitoring the status of the IBM MQ entities:
- Top left - the status of the queue managers
- Top right - the status of the communication channels
- Bottom left - the status and messages details for the available queues
- Bottom right - the topics statuses (in this paper we do not cover this feature)
For this blog post, I used Docker and set up an IBM MQ server on a virtual Linux machine by following the instructions from this link. The IBM jar library was exported via Docker directly from the test environment.
JMeter Setup & Configuration
JMeter will simulate the client in the IBM MQ structure. To do that, it needs the relevant APIs. Therefore, it is necessary to provide JMeter with the classpaths to two jar libraries:
- com.ibm.mq.allclient.jar - this jar can be exported from the IBM MQ installation fold3er. “/JavaSE” contains that jar.
- javax.jms-api-2.0.1.jar - can be downloaded directly from this MVN Repository.
How to proceed to add these jar libraries:
1. Create a subfolder in JMeter “lib” called “ibmmq”. Then place the jars in that folder.
2. Modify into JMeter installation the JMeter user.properties file by adding the classpath field with the complete or relative path of the ibmmq folder.
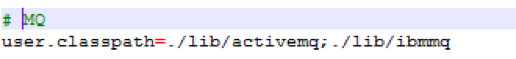
If everything is ok in the jmeter.log, then you will see a message at startup that ensures that the new folder in the classpath was loaded correctly.

We are now ready to create our load testing script.
Creating Your JMeter IBM MQ Load Testing Script
This part will describe how to compose the JMeter script. We will start with the creation of the client - as producer and consumer thread groups. Then, we will configure the connection to the IBM MQ service with setUp and tearDown thread groups. Finally, we will configure listeners.
Configuring the Client - the Consumer and Producer Thread Groups
The core of the script is two thread groups: one for the production of messages and the other for the consumption of messages. These thread groups simulate the client - either as the parts that sends or the part that receives the messages. The choice to separate the two operations into different thread groups enables the independence of the producer and the consumer actions.
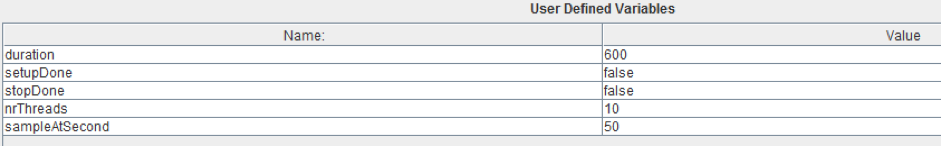
To centralize the configuration of the Thread Groups, select the “Test Plan” node and add the following user defined variables:
- “duration” equals “600”
- “setupDone” equals “false”
- “stopDone” equals “false”
- “nrThreads” equals “10”
- “sampleAtSecond” equals “50”
Now let’s add the first thread group.
Right click on “Test Plan” Add -> Threads -> Thread Group
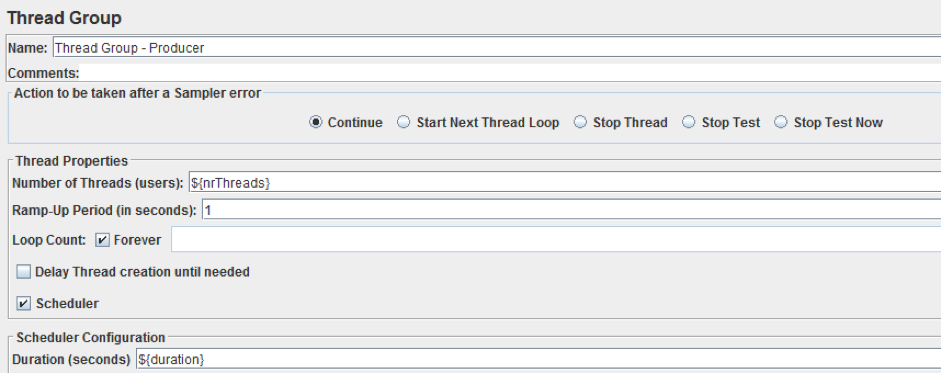
- Fill the “Name” field with “Thread Group - Producer”
- Fill the “Number of Threads” field with ${nrThreads}
- Fill the “Ramp-Up Period” field with 1
- Check the “Forever” flag on the “Loop Count” row
- Check the “Scheduler” flag
- Fill the “Duration” field with ${duration}
Now the second thread group. Right click on “Test Plan” Add -> Threads -> Thread Group
Select the “Thread Group” node and:
- Fill the “Name” field with “Thread Group - Consumer”
- Fill the “Number of Threads” field with ${nrThreads}
- Fill the “Ramp-Up Period” field with 1
- Check the “Forever” flag on the “Loop Count” row
- Check the “Scheduler” flag
- Fill the “Duration” field with ${__jexl2(${duration}+10)}
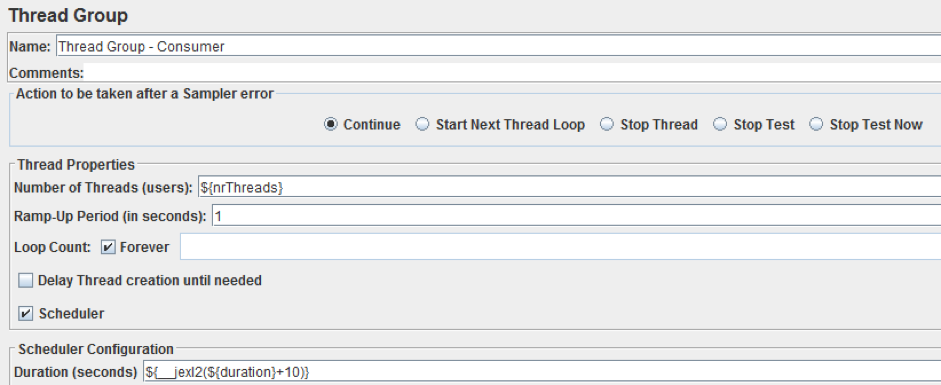
Why did we configure the consumer duration to be 10 seconds longer? To make sure that all the sent messages are received. Without these 10 seconds, both thread groups end at the same time, and the consumer would miss some messages in the “fly”.
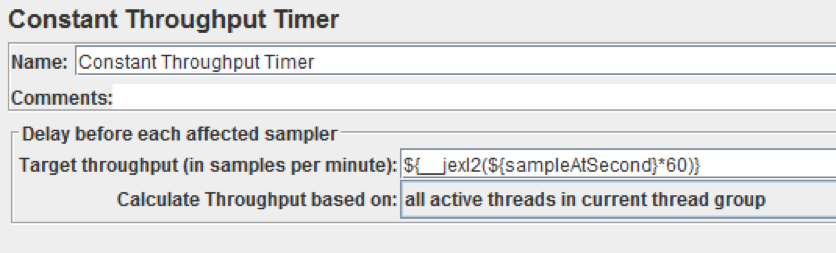
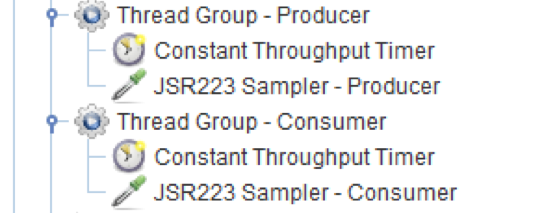
Now add a “Constant Throughput Timer” to each Thread Group, to set up how many requests per second will be invoked for production and consumption activities. While only production activities inject new messages into IBM MQ, the consumption activity also loads the server. This is because it generates a protocol message exchange (e.g. TCP). For these reasons, both activities will be tracked separately in the listener section (as we will see later).
Right click on “Thread Group - Producer/Consumer“ -> Add -> Timer -> Constant Throughput Timer
Both timers require the same configuration:
- “Target Throughput” equals to ${__jexl2(${sampleAtSecond}*60)}
- “Calculate Throughput based on” equals to “all active threads in current thread group”
Now it's time to add samplers! As briefly written before, this JMeter script is based on Groovy. To use Groovy in the JMeter script, we need to add the “JSR223 Sampler” to each thread group.
Right click on “Thread Group - Producer/Consumer“ -> Add -> Timer -> JSR223 Sampler
The required configuration is quite similar except for name:
- Change the “Name” field and add “Producer” or “Consumer” respectively
- Ensure that the language is “Groovy”
- Flag the “Cache compiled script if available” checkbox
Now it's time to fill out the script section for both JSR223 Samplers with Groovy code.
Producer Groovy Code
import java.time.Instant

// 1
def sess = System.getProperties().get("Session")
def destination = System.getProperties().get("Destination")

// 2
def producer = sess.createProducer(destination)

// 3
def rnd = new Random(System.currentTimeMillis())

// 4
def payload = String.format("JMeter...IBM MQ...test message no. %09d!", rnd.nextInt(Integer.MAX_VALUE))
def msg = sess.createTextMessage(payload)

def start = Instant.now()

// 5
producer.send(msg)

def stop = Instant.now()

// 6
producer.close()

// 7
SampleResult.setResponseData(msg.toString())
SampleResult.setDataType( org.apache.jmeter.samplers.SampleResult.TEXT )
SampleResult.setLatency( stop.toEpochMilli() - start.toEpochMilli() )
The code determines the following scenario:
1. Take reference of the shared objects: Session and MQ Destination. These objects are used to establish a connection to the IBM MQ service. We will show how to configure them later on.
2. Create a new producer
3. Used just to add a random time value (for differentiating the messages in the results)
4. Create a TextMessage and assign it a payload
5. Send message to IBM MQ
6. Close the producer
7. Add information to the SampleResult object that can be seen in Listeners
Consumer Groovy Code
import javax.jms.TextMessage
import javax.jms.BytesMessage

import java.time.LocalDate
import java.time.LocalTime
import java.time.Instant
import java.time.format.DateTimeFormatter

// 1
def sess = System.getProperties().get("Session")
def destination = System.getProperties().get("Destination")

// 2
def consumer = sess.createConsumer(destination)

def start = Instant.now()

// 3
def msg = consumer.receive(1000)

def stop = Instant.now()

// 4
if (msg != null) {
            // 5
	if (msg instanceof BytesMessage) {
		def tmp = msg.asType(BytesMessage)
		log.debug("#### Incoming BytesMessage contains " + tmp.getBodyLength() + " bytes")
	} else if (msg instanceof TextMessage) {
		def tmp = msg.asType(TextMessage)
		log.debug("#### Incoming TextMessage contains -> " + tmp.getText())
	} else
		log.debug("#### Incoming message has unexpected format!")

            // 6
	LocalDate date = LocalDate.parse(msg.getStringProperty("JMS_IBM_PutDate"),
					DateTimeFormatter.ofPattern("uuuuMMdd"))
	LocalTime time = LocalTime.parse(msg.getStringProperty("JMS_IBM_PutTime"),
					DateTimeFormatter.ofPattern("HHmmssSS"))

	// 7
            def timestampDetail = String.format("#### Incoming message was placed in queue @ %s - %s", date, time)
	log.info(timestampDetail)

	// 8
            SampleResult.setResponseData(msg.toString() + "\n\n" + timestampDetail)
	SampleResult.setDataType( org.apache.jmeter.samplers.SampleResult.TEXT )
	SampleResult.setLatency( stop.toEpochMilli() - start.toEpochMilli() )

} else {
	log.info("#### Nothing to fetch!")
}

// 9
consumer.close()
The code determines the following scenario:
1. Take reference of the shared objects: Session and MQ Destination
2. Create a new consumer
3. Look for an incoming message from the consumer using a 1 second timeout
4. Receive API with timeout can return “null” when no message is available
5. Take the data from the incoming message, format a String with the data and place into a SampleResult so it can be seen in a JMeter listener (this is a sample piece of code).
6. Parse IBM MQ properties related to the timestamp of the “put message” (this is a sample piece of code).
7. Display the message put time in IBM MQ and in UTC (Universal Time Coordinated).
8. Add information to the SampleResult object that can be seen in the Listeners
9. Close the consumer
Configuring the Connection to the IBM MQ Service
As mentioned, the Session and Destination objects are used to establish a connection to the IBM MQ service. In the code, the objects are referred to as shared objects (in step 1). This solution is necessary for:
- Reducing redundant code
- Reusing connections among all threads
The creation if the Session and Destination shared objects and the connection to the IBM MQ service must be ready before the producer/consumer thread group starts to require them. How can we guarantee this precondition? By using the “setUp Thread Group” and “tearDown Thread Group” elements, to handle the creation and destruction of the required shared objects in JMeter.
Setup/Teardown of Shared Objects
Thread Groups called “setUp” and “tearDown” are respectively pre-test and post-test for each normal thread group present into script. We already have two thread groups, one for the producer and one for the consumer. So, to guarantee the unique execution of “setUp” and “tearDown” we need to add a guard condition.
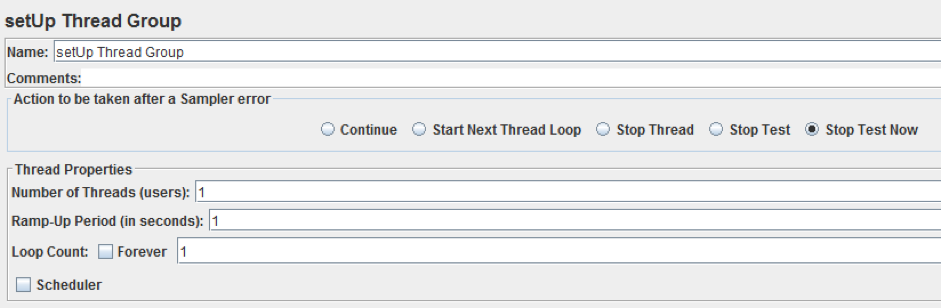
setUp Thread Group
Right click on “Test Plan” Add -> Threads -> setUp Thread Group
The only configuration in this node is modify “Action to be taken after a Sample error” to “Stop Test Now”. This will save us time in case of an error during setup.
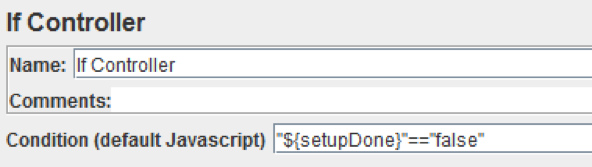
Right click on “setUp Thread Group” -> Logic Controller -> If Controller
The only configuration required here is to fill the “Condition” field with the text "${setupDone}"=="false". This is a boolean check to avoid double execution of thread group setup.
Right click on “If Controller“ -> Add -> Timer -> JSR223 Sampler
The required configuration is:
- Change the “Name” field to “JSR223 Sampler - Setup”
- Ensure that the language is “Groovy”
- Flag the “Cache compiled script if available”
Now it's time to fill the script section in the JSR223 Sampler with Groovy code:
import com.ibm.msg.client.jms.JmsConnectionFactory
import com.ibm.msg.client.jms.JmsFactoryFactory
import com.ibm.msg.client.wmq.WMQConstants

import javax.jms.Session

// 1
def hostName = "127.0.0.1"
def hostPort = 1414
def channelName = "DEV.APP.SVRCONN"
def queueManagerName = "QM1"
def queueName = "DEV.QUEUE.1"

// 2
def ff = JmsFactoryFactory.getInstance(WMQConstants.WMQ_PROVIDER)
def cf = ff.createConnectionFactory()

// 3
cf.setStringProperty(WMQConstants.WMQ_HOST_NAME, hostName)
cf.setIntProperty(WMQConstants.WMQ_PORT, hostPort)
cf.setStringProperty(WMQConstants.WMQ_CHANNEL, channelName)
cf.setIntProperty(WMQConstants.WMQ_CONNECTION_MODE, WMQConstants.WMQ_CM_CLIENT)
cf.setStringProperty(WMQConstants.WMQ_QUEUE_MANAGER, queueManagerName)

// 4
def conn = cf.createConnection("app", "test")
def sess = conn.createSession(false, Session.AUTO_ACKNOWLEDGE)

// 5
def destination = sess.createQueue(queueName)

conn.start()

log.info("#### Start completed!")

// 6
System.getProperties().put("Session", sess)
System.getProperties().put("Connection", conn)
System.getProperties().put("Destination", destination)

// 7
vars.put("setupDone", "true")
The code determines the following scenario:
1. The configuration parameters for the IBM MQ service are centralized here. (Remember we prepared these parameters before?)
2. Creates a factory object connection
3. Sets the properties of the factory object connection
4. Creates a connection with the connection credentials and sets up the Session object
5. Creates a Destination object
6. Saves the object that will be shared among thread groups
7. Set the “setupDone” to “true” so the “If Controller” cannot be executed two times in this run.
tearDown Thread Group
Right click on “Test Plan” Add -> Threads -> tearDown Thread Group
The only configuration in this node is modify “Action to be taken after a Sample error” to “Stop Test Now”. This saves time in case of an error during teardown.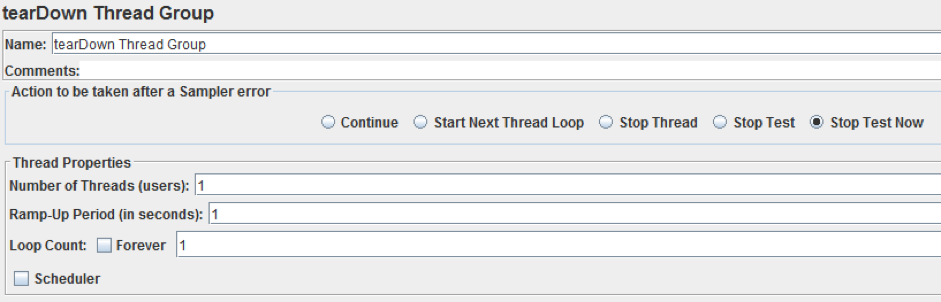
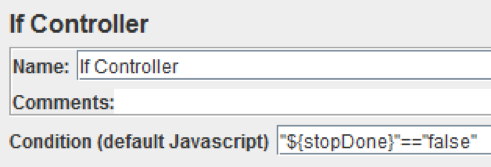
Right click on “tearDown Thread Group” -> Logic Controller -> If controller
The only configuration here is to fill the “Condition” field with the text "${stopDone}"=="false". This is a boolean check to avoid double stop execution.
Right click on “If Controller“ -> Add -> Timer -> JSR223 Sampler
The required configuration is:
- Change the “Name” field to “JSR223 Sampler - Stop”
- Ensure that the language is “Groovy”
- Flag the “Cache compiled script if available” button
Now it's time to fill script section for the JSR223 Sampler with Groovy code:
// 1
System.getProperties().get("Session").close()
System.getProperties().get("Connection").close()

log.info("#### Stop completed!")

// 2
vars.put("stopDone", "true")
The code determines the following scenario:
1. Invoke the close Session and Connection objects (for saving machine resources)
2. Set the “stopDone” to “true” in manner that “If Controller” cannot be executed two times into this run.
After adding a listener, the complete script appears like in the screenshot below.
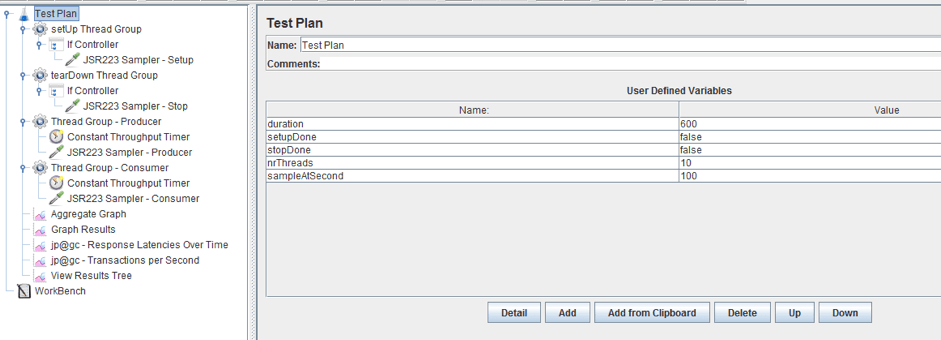
This is the test flow:
- As the script starts, JMeter knows that two Thread Groups (Producer and Consumer) should be executed. So it executes the "setUp Thread Group" two times.
- "setUp Thread Group" creates the shared objects “Session” and “Destination” and establishes the connection to the IBM MQ service
- Only the first "setUp Thread Group" execution reaches the “JSR223 Sampler - Setup” because “setupDone” filters second execution.
- The Producer and Consumer Thread Groups use the shared objects to create loads by putting and getting messages
- The listeners track the information as expected by them
- Both Producer and Consumer Thread Group conclude execution and try to execute "tearDown Thread Group". But only the first one can because "stopDone" variable acts as filter.
Analyzing Your IBM MQ Performance Test Results
In this section I will explain the different listeners that can be added to your JMeter script and what you can learn from them.
Transactions per second
The goal of this listener is to show how many requests per second are processed both for the producer and the consumer samplers.
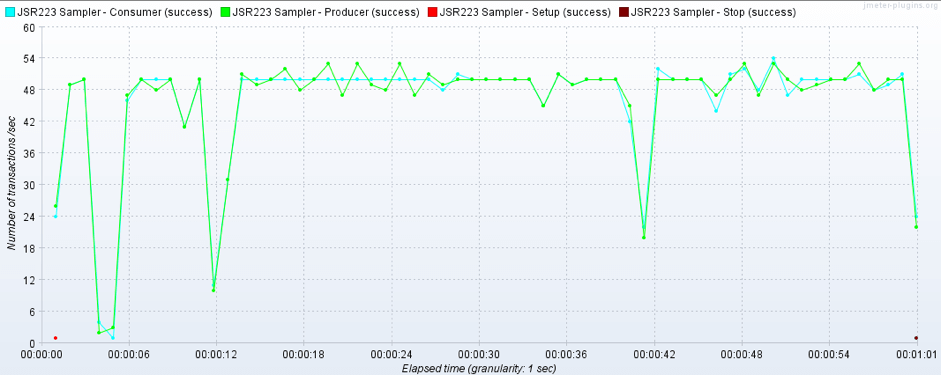
Based on the “User defined variables” described before, both transaction graphs are centered on 50 trans/sec. In case of performance degradation, the graphs will show a lower value. At this point you should investigate the reasons for that (e.g. resources consumption, bandwidth limit, etc.).
Note that in this listeners is showed two dots relative to setup and teardown transition.
Aggregate Report
This listener is important for gaining an overall view of the passing/failing of samples.

The “Error %” column is the summary of failed transactions. It is important especially during script debugging, to investigate if the errors are caused by performance issues or code issues (e.g. wrong authentication parameters).
At the end of the script execution, the producer and the consumer should have the same number of samples. Otherwise, this means the test missed messages or that other messages sources interfered with the test.
Response Latencies Over Time
This listener shows a plot of execution time of methods: “send” for producers and “receive” for consumers.
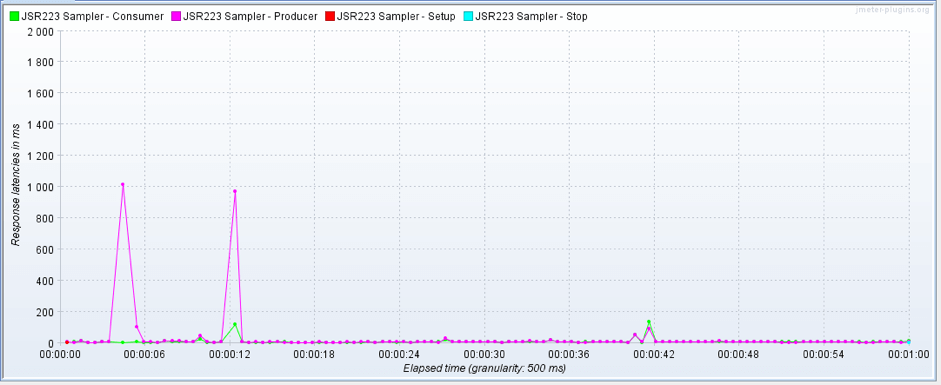
To obtain these graphs, we added the “setLatency” method call into our producer/consumer code. This method measures the milliseconds elapsed for the “send” and “receive” methods.
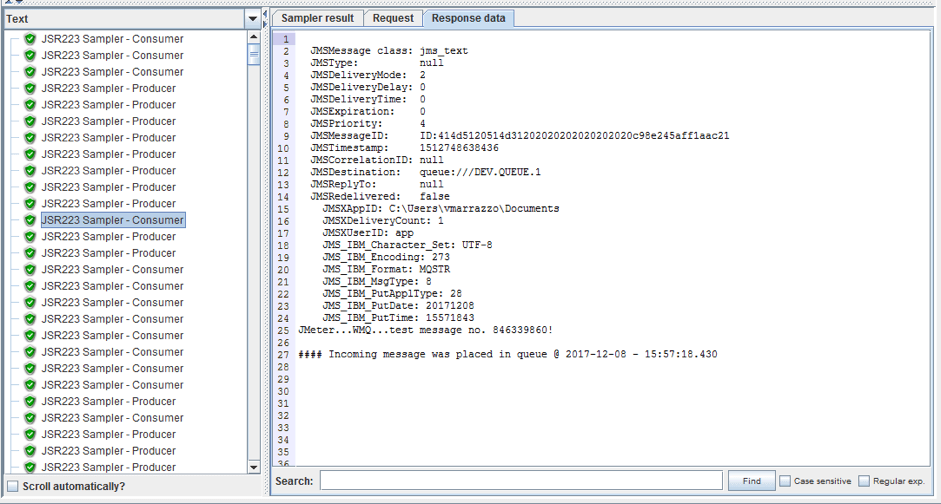
View Results Tree
This listener is useful for debugging purposes but it’s highly recommended not to use it in real tests, especially for the long run.

The information displayed in this listener is influenced by the “SampleResult”, as shown in last line of code in the producer/consumer script. In this example, you can also look at the messages that were produced and consumed on the “Response data” tab of the listener.
This paper described a practical approach to performance testing IBM MQ with JMeter, by using standard components and a programmatic approach. We did not use the default JMS Publisher/Subscriber elements, because we recommend to create your own custom sampler.
This is because when customizing your own samplers you have more flexibility, including extension possibilities (e.g. Perfmon listener or support for TLS/SSL connection). You also save time because you don’t need to configure the parameters (e.g. channel name, queue manager, TLS/SSL secure connection, etc.).
That’s it! You now know how to create a load test for your IBM MQ service with JMeter. To learn more advanced JMeter, check out BlazeMeter University.