Blog
November 13, 2020
The Complete Guide to Continuous Integration With Jenkins

Open Source Automation,
DevOps
Today, I’ll be showing you how to add your performance testing with JMeter to a Jenkins Continuous Integration build. Not only are they leading tools for performance testing and Continuous Integration, but they also have great documentation and large, active communities where you can ask questions.
But first, let's discuss some background about why performance testing is critical to the CI process.
Back to topWhat is Continuous Integration in Jenkins?
Continuous Integration is facilitated by Jenkins. Continuous Integration (CI) systems orchestrate software build, testing, and deployment processes. Jenkins is one of the most popular open-source automation servers that help facilitate successful CI implementation.
In short, continuous integration systems like Jenkins:
Monitor source code repositories
Run build whenever code changes are detected
Run tests against compiled software (unit, acceptance, automated, performance, integration etc.)
Generate artifacts (binaries, documentation, installation packages, etc.)
Why Continuous Integration is Crucial
When a developer is working on a new feature or fixing a defect, he needs to ensure that these changes won’t have a negative impact on other software parts which were previously working perfectly. To make the process as efficient as possible, it should be unattended.
It’s no wonder that CI systems are being widely adopted by software development companies. In fact, Continuous Integration is now a vital part of the modern software development life cycle.
In fact, by implementing a Continuous Integration system like Jenkins in your workflow, you’ve already checked off the first three items of Joel Spolsky’s 12 Steps to Better Code. For the uninitiated, these are:
Do you use source control?
Can you make a build in one step?
Do you make daily builds?
Why Performance Testing is Important in Your CI Process
Adding performance tests to your CI scope will help you reduce the risk of performance degradation whenever you add a new feature or fix a bug on your product.
For example: if your latest commit inadvertently causes response times to go above an acceptable threshold or SLA, your CI system will automatically raise a ‘red flag’ and mark the build as ‘failed’. This will make it very easy for you to identify the cause (and the responsible person! :) behind the problem.
What’s more; it’s much better to start running performance tests in the early software development stages. If you detect a major error in the pre-release phase, it will be much harder to identify and fix the issue.
Back to topHow to Install the Jenkins Continuous Integration and JMeter Plugin
In this article, I’m assuming that you already have Jenkins up and running somewhere. If you want to experiment, it’s pretty easy to get Jenkins to start with continuous integration. Here’s how:
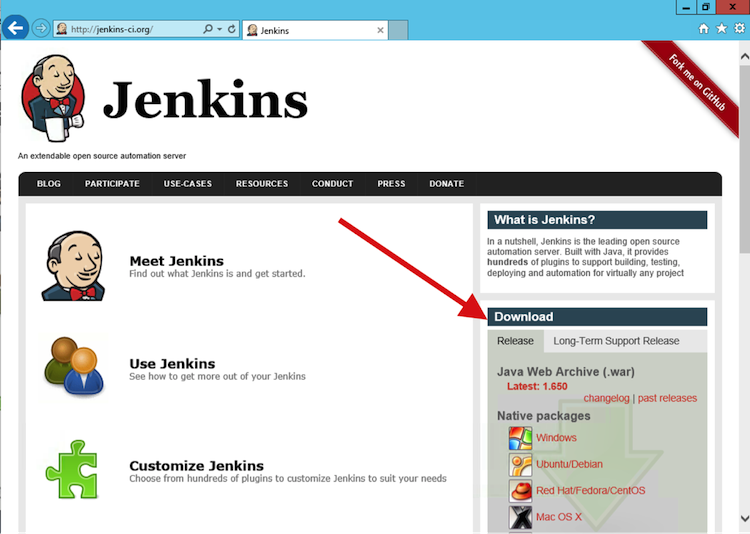
1. Download the latest Jenkins release from the site (note: the .war file should be quite enough).
2. Run Jenkins as java -jar jenkins.war and wait for the “Jenkins is fully up and running" message.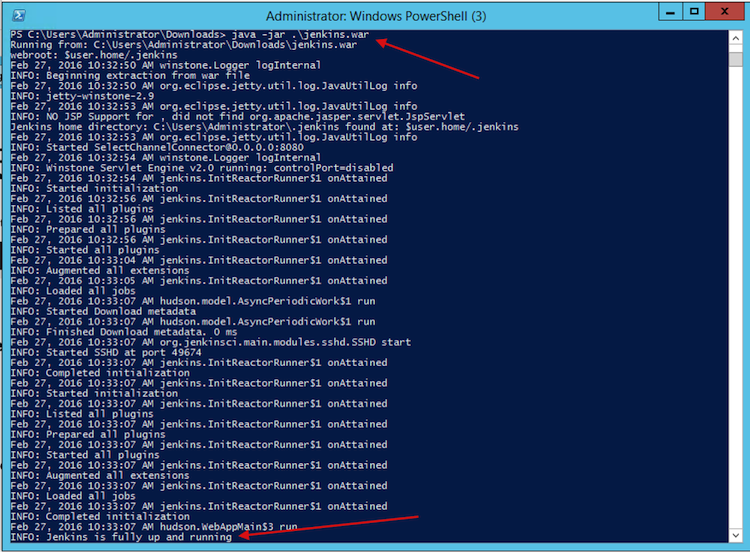
3. Open the localhost URL in your favorite browser.
4. You should now be able to see the Jenkins dashboard.
To get JMeter support on Jenkins, you need to use the Performance Plugin. Once again, it’s really easy to install this plugin. Here’s how:
Download the latest version of the plugin from the Performance Plugin page.
Copy the performance.hpi file to the plugins folder of your Jenkins’ installation. If you run Jenkins from the .war file - drop the plugin to the .jenkins/plugins path under your user home folder.
Restart Jenkins to pick the plugin up.
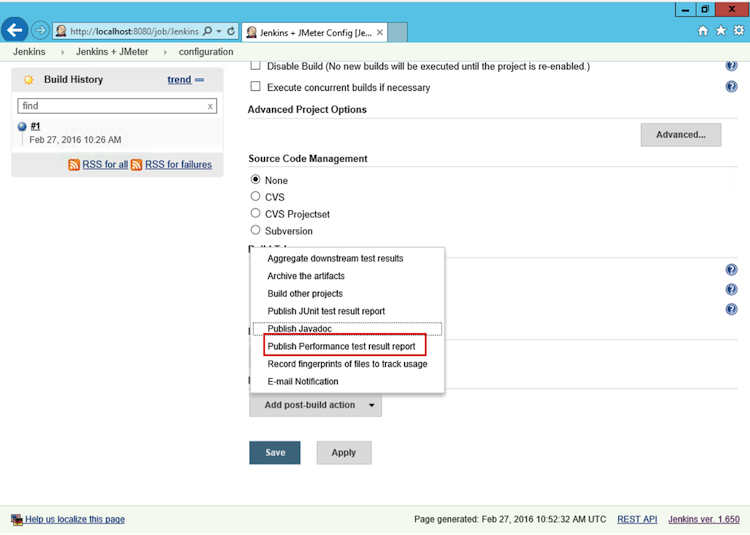
If everything is fine you should see the “Publish Performance Test Result Report” option under Jenkins -> Your Project -> Configure -> “Add post-build action” dropdown.
How to Run a JMeter Test in Jenkins
You’ll be happy to hear that running a JMeter load test as part of your Jenkins continuous integration isn’t very complex. Just remember that the test has to be run in non-GUI mode.
For your first couple of runs, I recommend “telling” JMeter to store its results in an XML format using one of these approaches:
Add the jmeter.save.saveservice.output_format=xml line to the user.properties file (this is located in /bin folder of your JMeter installation).
Pass the property via the -J command-line argument, such as: C:\jmeter\bin\jmeter.bat -Jjmeter.save.saveservice.output_format=xml -n -t C:\jmeter\extras\Test.jmx -l Test.jtl.
You can also use CSV files with the Performance Plugin. However, this requires extra configuration whereas XML files work fine out of the box.
Here’s how it looks when you configure the Windows batch command to run a JMeter test: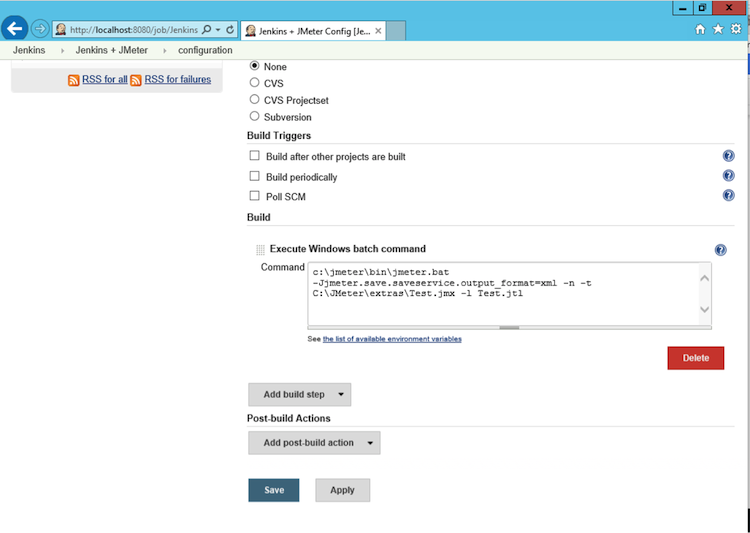
To verify the execution was successful (or to get extra information regarding any problems), check the “Console Output” tab of the project in question.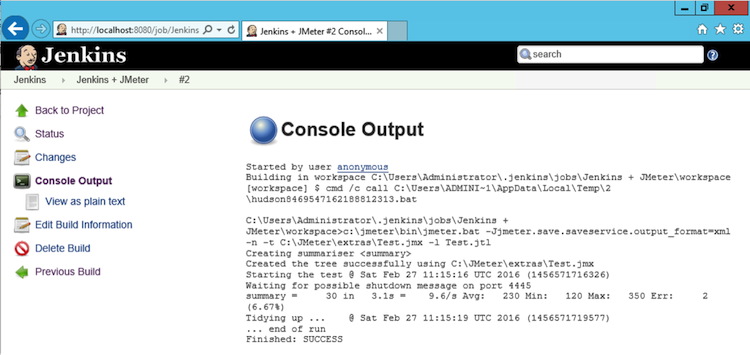
In the JMeter log file and the .jtl results file, you can find it under the Project’s “Workspace”.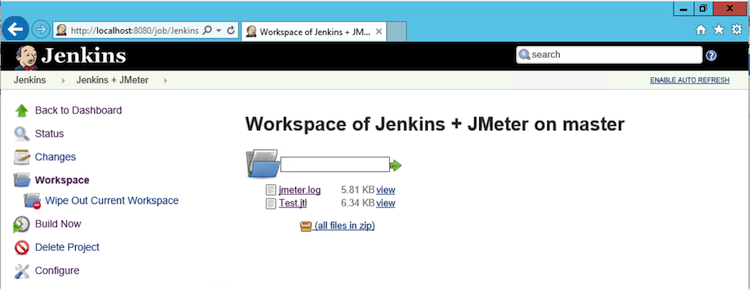
How to Use the Performance Plugin for Jenkins CI
The Performance Plugin displays statistics, and trends and can also be used to mark builds as failed based on results.
Here’s how you add it:
Open the Jenkins project.
Click the “Configure” button.
Click the “Add post-build action” button.
Select:
“JMeter” if your results file is in an XML format.
“JMeterCSV” if your results file is in a CSV format.
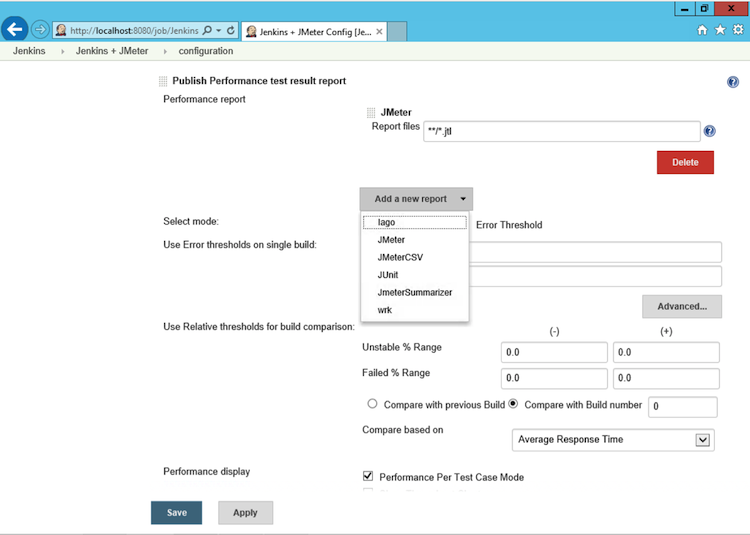
“Report Files” is the main configuration option here. This is the path where the plugin will scan for JMeter results’ files. The format matches the Ant Fileset include/exclude format, and it is relative to the Jenkins Workspace for the project.
All the other names of the settings here are quite self-explanatory.
On the first build with the plugin enabled, you’ll see empty charts for the “Performance Trend.”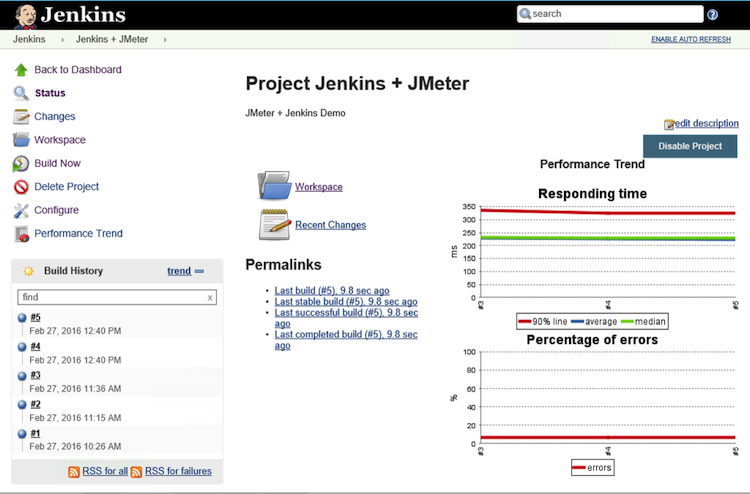
The charts will change as you create more builds. They will display average, median and 90 percentile values along with the errors count. The charts are clickable, so you can get more detailed information on each executed sampler.
Passing Jenkins Parameters to a JMeter Test
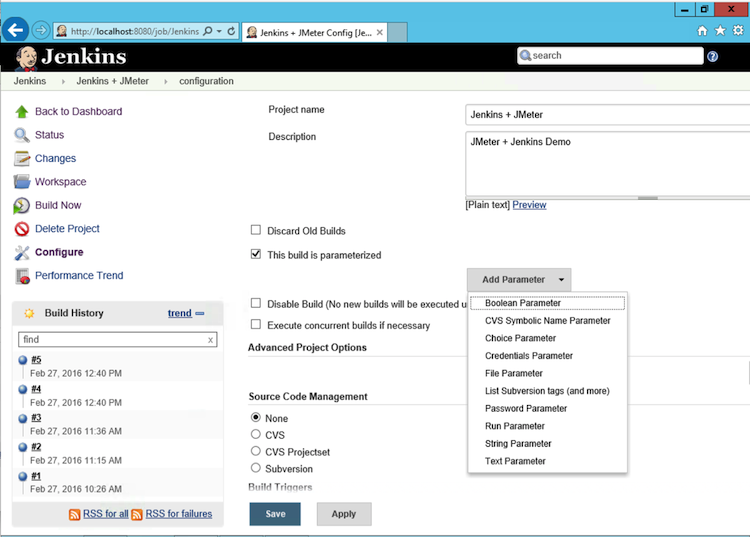
Jenkins allows you to specify build parameters. For example: if you tick the “This build is parameterized” box on the “Configure” page, you’ll be able to set some parameter names along with the default values:
This means that you can perform the configuration of your JMeter test without having to change anything in your .JMX script or Ant or Maven configuration.
For instance, if you define the parameter with the name “foo” and the value “bar”, you can refer to it as:
%foo% - if the Jenkins build is executed on a Windows machine.
$foo - if the Jenkins build is executed on Linux, Unix, or MacOSX machine.
See below for an example of setting a JMeter thread count and accessing it from a JMeter Windows batch command text: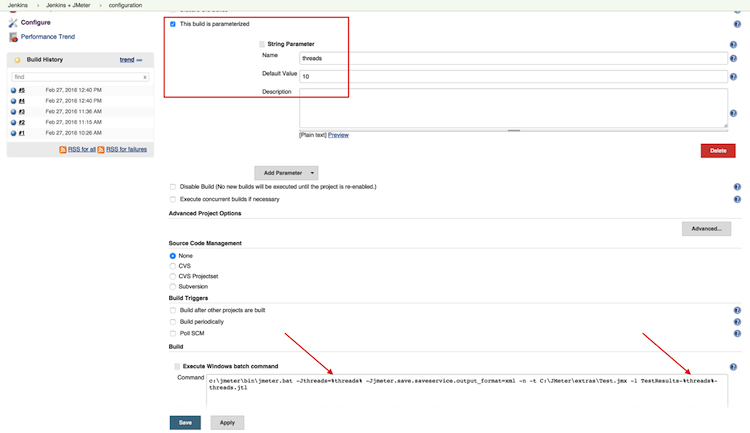
If you run the build once more and take a look into the “Console Output”, you’ll see that the %threads% variable has been changed with the relevant parameter value: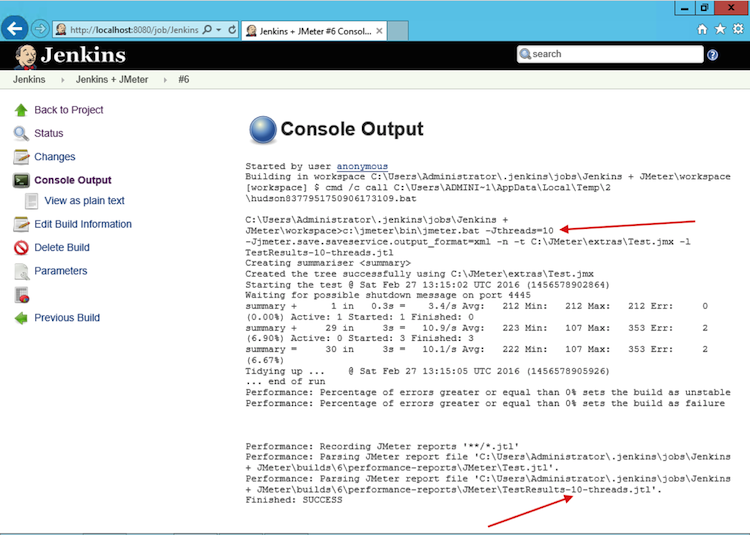
Bottom Line
Congratulations! You’re now ready to start using JMeter with Jenkins Continuous Integration. If you’re a BlazeMeter user, you can use BlazeMeter's Jenkins Plugin to kick off a test in the BlazeMeter cloud directly from Jenkins.