Blog
March 27, 2017
JMeter Web Testing: How To Properly Handle Embedded Resources in HTML Responses

Open Source Automation
The main question that load testing answers is how many concurrent users can my web application support? In order to get a proper answer, load testing (and in this case, JMeter web testing) should represent real application usage as closely as possible.
The process of building a well-behaved load test is quite complex as a lot of aspects need to be considered, but the general idea is this: there should be a one-to-one mapping of JMeter’s virtual user to a real user.
This article covers only one of many techniques to do this, and it is the handling of the so called “embedded resources” during JMeter web testing. This is quite important, since if you only send a HTTP Request to a URL endpoint using JMeter, you will get HTML in the response, but it will have nothing in common with what real browsers do.
Back to top
1. Why Include Embedded Resources in JMeter Web Testing?
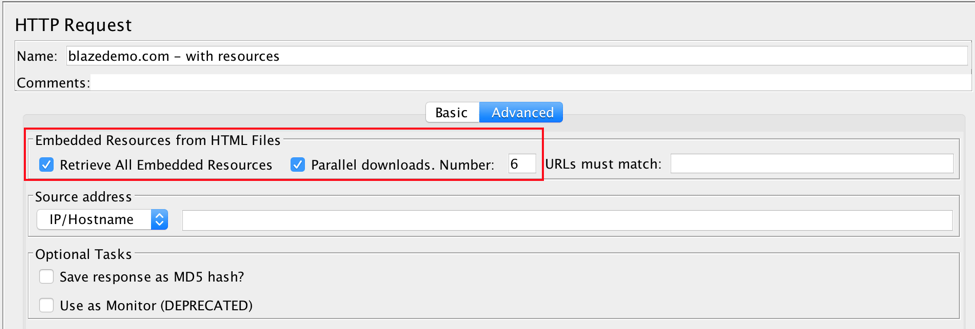
Embedded resources are JMeter web testing resources that are required for by the HTML page to be fully functional and loaded along with page itself. Now let’s do an experiment: create two HTTP Request samplers to hit http://blazedemo.com website; with the first one not downloading embedded resources and the other one downloading them. The relevant configuration is located in the “Advanced” tab of the HTTP Request sampler.
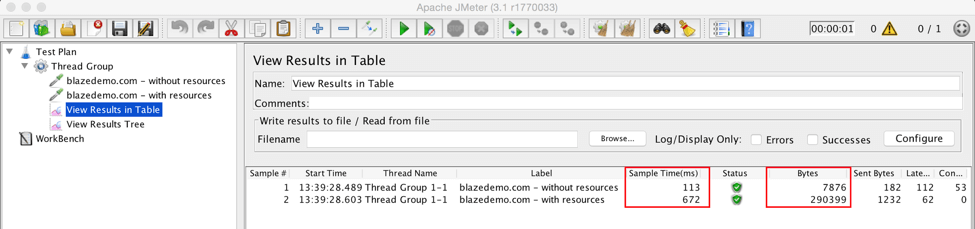
Now let’s look at the View Results in Table listener. There are two main differences:
- For the “with resources” request, the response time is 6x times higher
- For the “with resources” request, received bytes are 36x times higher
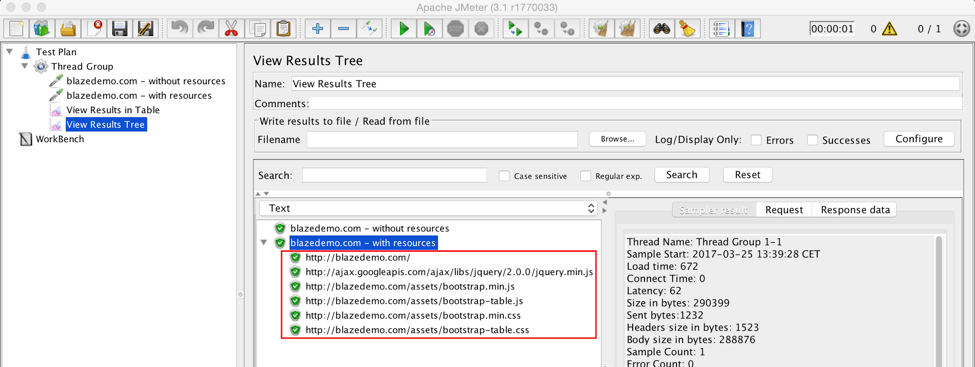
Looking at the View Results Tree listener, there are several extra requests that are targeting .css and .js files referenced in the main BlazeDemo site main page.
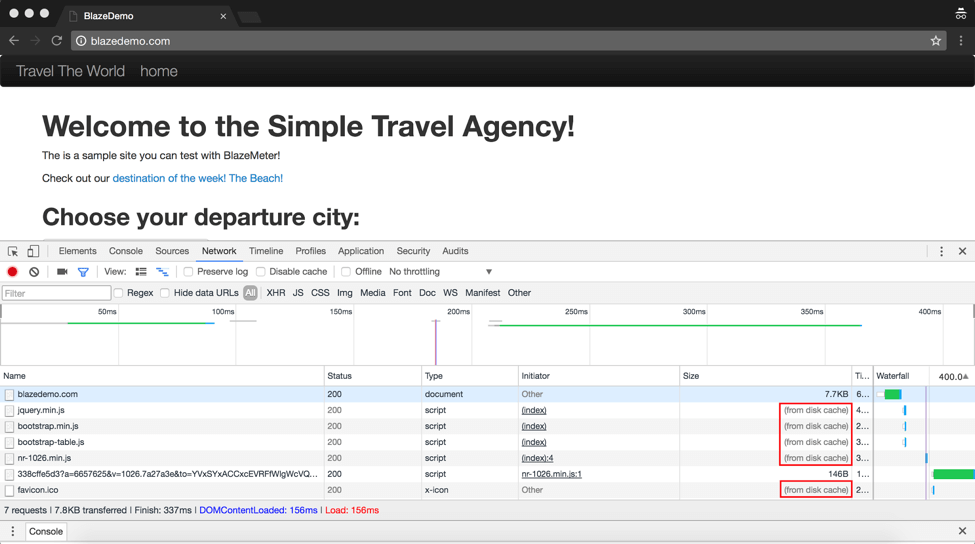
Now let’s look at what happens in the real browser in the browser developer tools:
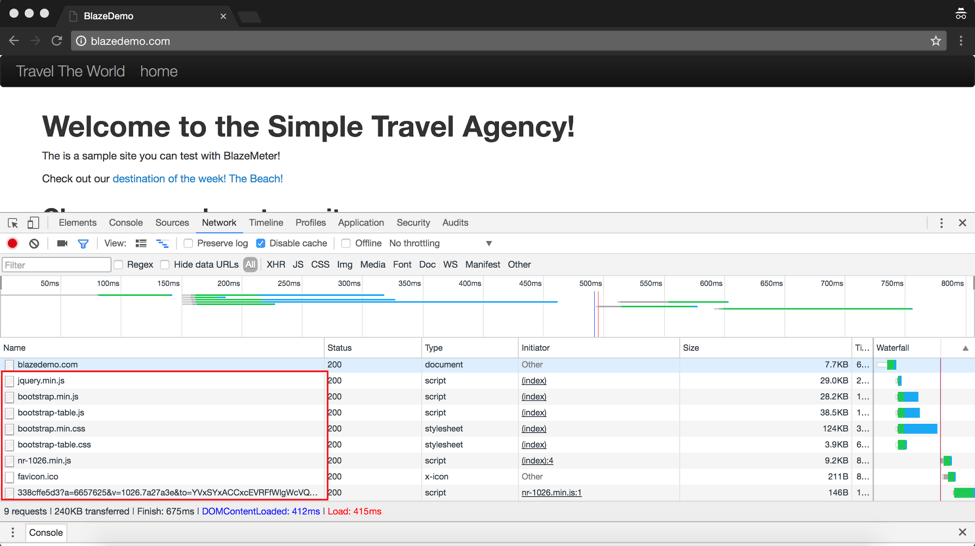
This is the main point of why your test needs to include embedded resources referenced in web pages that are being hit by JMeter requests. This is what real browsers do and this is what JMeter should be doing when it comes to web applications load testing. Otherwise, the results you are getting are not accurate.
Back to top
2. Don’t Record Embedded Resources Calls
Real browsers act as follows:
- 1 request to the main page
- Parallel requests to all referenced “embedded resources” (images, scripts and styles)
If you record calls to embedded resources, they will be executed one by one. This behavior doesn’t match what real browsers are doing, so your test will not accurately represent the real load pattern and results will not be inline with the actual web application usage.
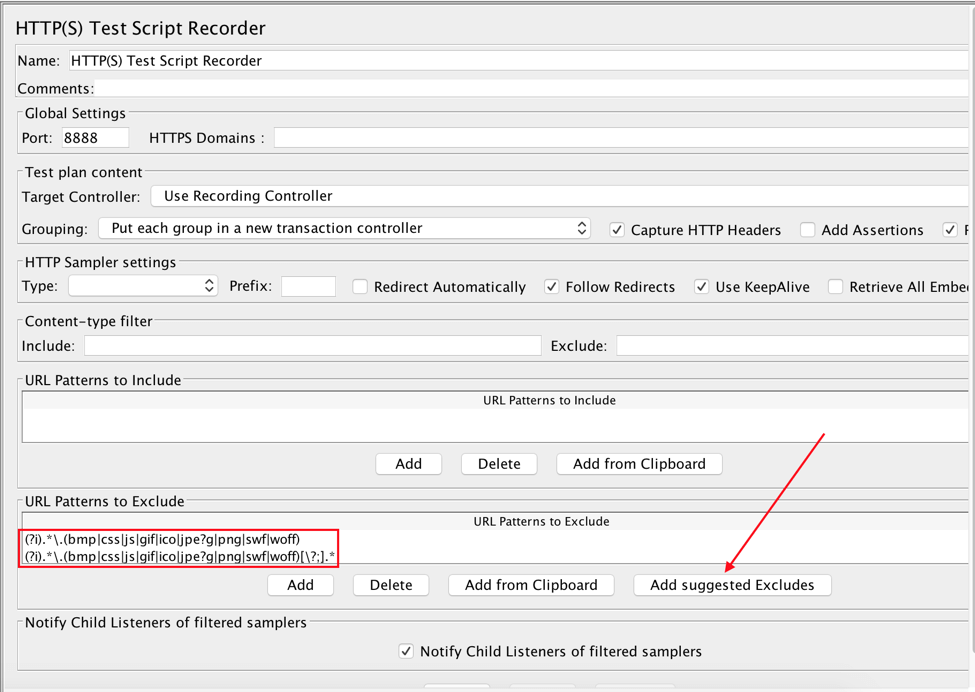
That’s why you should exclude these calls during test scenario recording. This can be done via “URL Patterns to Exclude” input of the HTTP(S) Test Script Recorder. There, you can define which URLs need to be excluded using Perl5-style regular expressions. Clicking the “Add Suggested Excludes” button will populate recommended exclusion options.
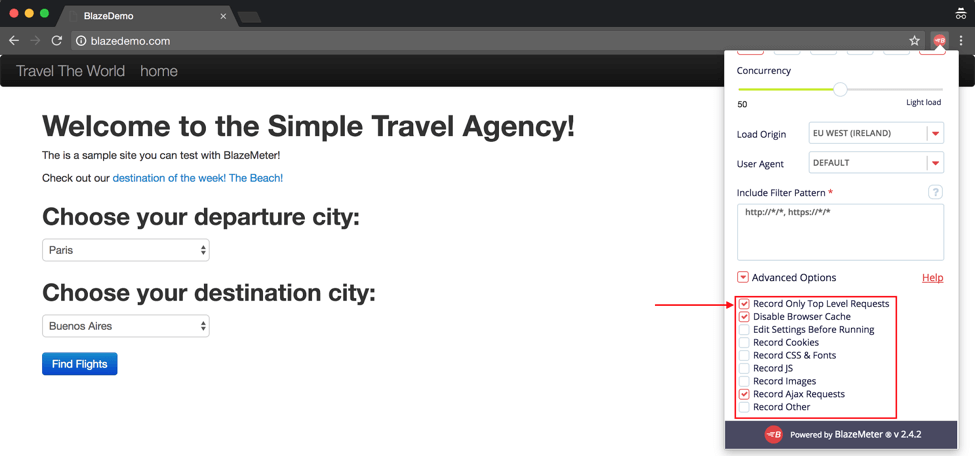
BlazeMeter Chrome Extension users have this behavior pre-configured (however you can configure this to your need by using the “Advanced Options” section).
Back to top
3. Don’t Include External Embedded Resources in Your Load Test
Let’s get back to View Results Tree listener and see which embedded resources calls are being made:
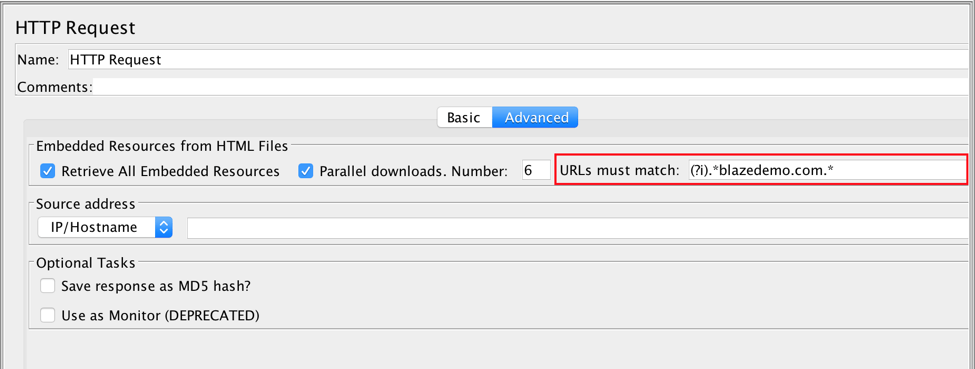
Apart from .css and .js files residing under the “blazedemo.com” domain, there is one JavaScript file which is being fetched from the “ajax.googleapis.com” website. We are not interested in the response time of this resource as it isn’t something we can control. So in order to focus solely on the BlazeDemo website, we should configure JMeter to execute calls to resources that live only in the “blazedemo.com” domain. Which resources will be considered is controllable via the “URLs must match” input of the HTTP Request sampler.
4. Don’t Forget About Browser Cache
Real browsers do download embedded resources, however on subsequent requests they don’t re-download them. Rather, the resources are being returned from the browser’s cache.
Your JMeter testing needs to handle this situation as well, or it will be creating hundreds of extra requests that don’t happen in reality. That’s why it is very important you add a HTTP Cache Manager to your Test Plan. The HTTP Cache Manager represents browser cache and respects cache control headers, so JMeter acts exactly like a real browser with regards to handling embedded resources caching.
Back to top
5. Don’t Repeat Yourself
Instead of applying embedded resources handling configuration under individual HTTP Request samplers, it is better to manage this “centrally” by using HTTP Request Defaults. Setting, configured in HTTP Request Defaults are propagated to all HTTP Request samplers in the scope. So, if you need to change a setting - you will be able to do so in one place only and won’t have to revisit each and every HTTP Request sampler.
Back to top
6. Putting Everything Together
In conclusion, handling embedded resources as part of your JMeter web testing assumes:
- Downloading “embedded resources” like images, CSS and JavaScript files
- Using the parallel thread pool
- Omitting embedded resources calls while recording your test scenario
- Excluding “alien” resources which don’t explicitly belong to application under test (external scripts, images, maps, videos, whatever)
- Using the HTTP Cache Manager to represent browser cache
- Using the HTTP Request Defaults to make script development and especially maintenance faster and easier
To accomplish this and other aspects of JMeter web testing more easily, try BlazeMeter today.