Blog
December 14, 2020

Sometimes it is necessary to check Apache JMeter’s logs. Usually, this happens when you are debugging problems with a script or with JMeter itself. JMeter logging can contain a lot of useful information when configured correctly. In this blog post we will learn to configure logging in JMeter, e.g., defining which events should be presented in the log.
Since JMeter version 3.2, logging is configured through an Apache Log4j 2 configuration file. The configuration file (log4j2.xml) is located in the bin directory of your JMeter. In previous versions, configuration was available via the jmeter.properties file.
If you check the jmeter.properties file of JMeter 3.2, you will find configurations for the Logger Panel. The Logger Panel is a panel where you can see logs in real time when JMeter is open.
Back to topHow to Configure the JMeter Logging Panel
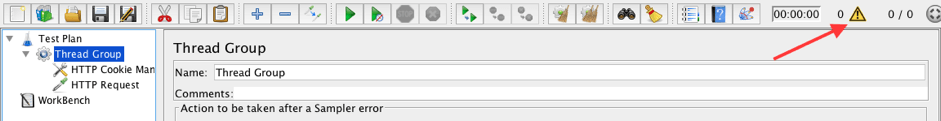
Use the Warning icon on the top panel of JMeter to toggle the Logger Panel.
Here are configurations for the Logger Panel in the jmeter.properties file:
#jmeter.loggerpanel.display=true/false
This option is responsible for opening/closing a Logger Panel each time JMeter is started.
#jmeter.loggerpanel.enable_when_closed=true/false
This option is responsible for receiving/ignoring a log event if the Logger Panel is closed.
#jmeter.loggerpanel.maxlength=1000
This option determines the maximum number of lines kept in the Logger Panel.
Back to topConfiguring the Log4j 2 Configuration File
Now, let’s take a closer look at the logging settings in the configuration file(log4j2.xml).
<?xml version="1.0" encoding="UTF-8"?>
<Configuration status="WARN" packages="org.apache.jmeter.gui.logging">
  <Appenders>
    <File name="jmeter-log" fileName="${sys:jmeter.logfile:-jmeter.log}" append="false">
      <PatternLayout>
        <pattern>%d %p %c{1.}: %m%npattern>
      PatternLayout>
    File>
    <GuiLogEvent name="gui-log-event">
      <PatternLayout>
        <pattern>%d %p %c{1.}: %m%npattern>
      PatternLayout>
    GuiLogEvent>
  Appenders>
  <Loggers>
    <Root level="info">
      <AppenderRef ref="jmeter-log" />
      <AppenderRef ref="gui-log-event" />
    Root>
    <Logger name="org.apache.jmeter.junit" level="debug" />

    <Logger name="org.apache.jmeter.control" level="debug" />
    <Logger name="org.apache.jmeter.testbeans" level="debug" />
    <Logger name="org.apache.jmeter.engine" level="debug" />
    <Logger name="org.apache.jmeter.threads" level="debug" />
    <Logger name="org.apache.jmeter.gui" level="warn" />
    <Logger name="org.apache.jmeter.testelement" level="debug" />
    <Logger name="org.apache.jmeter.util" level="warn" />
    <Logger name="org.apache.jmeter.protocol.http" level="debug" />
    -->


    <Logger name="org.apache.jmeter.protocol.http.control" level="debug" />
    <Logger name="org.apache.jmeter.protocol.ftp" level="warn" />
    <Logger name="org.apache.jmeter.protocol.jdbc" level="debug" />
    <Logger name="org.apache.jmeter.protocol.java" level="warn" />
    <Logger name="org.apache.jmeter.testelements.property" level="debug" />
    -->
    <Logger name="org.apache.jorphan" level="info" />

      # Apache HttpClient logging examples
    -->


    <Logger name="org.apache.http" level="debug" />
    <Logger name="org.apache.http.wire" level="error" />
    -->


    <Logger name="org.apache.http.impl.conn" level="debug" />
    <Logger name="org.apache.http.impl.client" level="debug" />
    <Logger name="org.apache.http.client" level="debug" />
    -->

      # Reporting logging configuration examples
    -->


      # More user specific logging configuration examples.
    -->


      # Warning: Enabling the next debug line causes javax.net.ssl.SSLException: Received fatal alert: unexpected_message for certain sites when used with the default HTTP Sampler
    -->

    <Logger name="org.apache.jmeter.util.HttpSSLProtocolSocketFactory" level="debug" />
    <Logger name="org.apache.jmeter.util.JsseSSLManager" level="debug" />
    -->

      # Enable Proxy request debug
    -->

  Loggers>
Configuration>
The configuration file contains two main parts: Appenders and Loggers.
The Appenders section is responsible for the format of messages in the log. It specifies the pattern of log messages. Patterns are the structure of each message in the log.
The default pattern looks like this: <pattern>%d %p %c{1.}: %m%npattern>
The %d means the log message will start from a certain date and time.
For example: 2017-12-06 17:34:22,558 INFO o.a.j.s.SampleResult: sampleresult.useNanoTime=true
So if we delete %d from the pattern: <pattern>%p %c{1.}: %m%npattern>, the message will look like this: INFO o.a.j.s.SampleResult: sampleresult.useNanoTime=true
Change it if you want another pattern.
The Loggers section is responsible for the content of the log. There are many options for changing the events presented in the log that could be useful in various cases. Let’s consider how to change the configuration and how it works in some real examples.
We need a short JMeter logging script to demonstrate making changes in our logging configuration. We will use the BlazeDemo website (http://blazedemo.com/) to create our script and run tests. This website is available for anyone who wants to play with load testing.
Let’s create the script!
1. Add a Thread Group to the Test plan.
Test plan -> Add -> Thread (Users) -> Thread Group
2. Add an HTTP Cookie Manager to the Thread Group.
Thread Group -> Add -> Config Element -> HTTP Cookie Manager
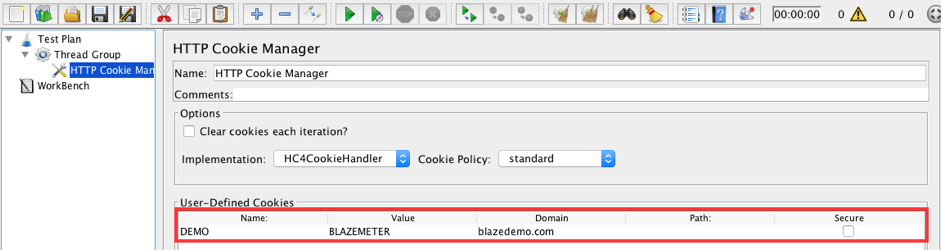
Add the following row to the User-Defined Cookies area:
- Name: DEMO
- Value: BLAZEMETER
- Domain: blazedemo.com
This config element is needed to demonstrate logging configuration possibilities for HTTP Controls.
3. Add an HTTP Request that opens the landing page of the test web app.
Thread Group -> Add -> Sampler -> HTTP Request
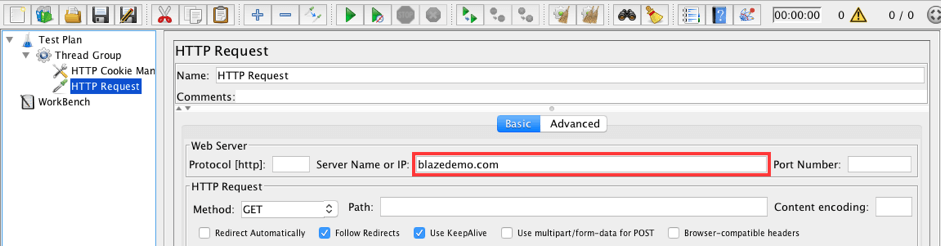
Set the following value:
- Server name or IP: blazedemo.com
This sampler is needed to demonstrate logging configuration possibilities for HTTP Requests.
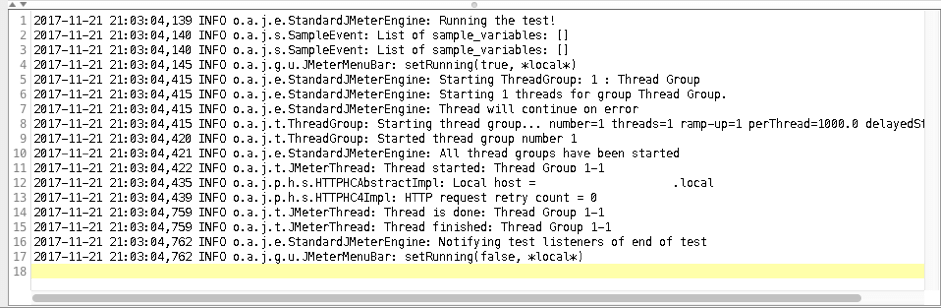
4. Run the script and check the log.
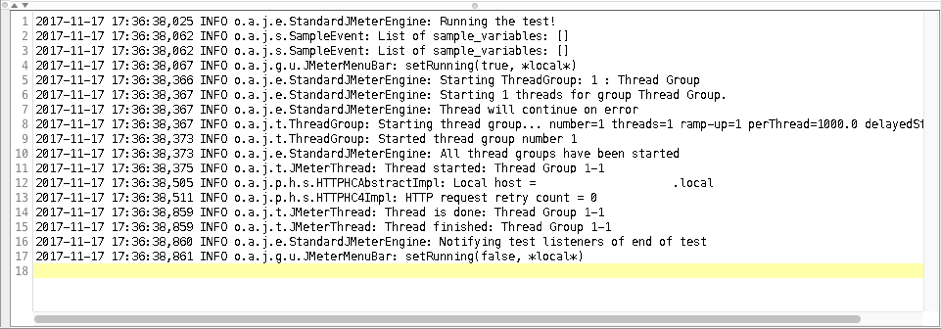
The log contains basic information about our test run. There is no information about cookies or about the content of the HTTP Request.
Option 1 - Changing the Configuration Using the log4j2.xml File
5. Uncomment the next line of code in the log4j2.xml file:
<Logger name="org.apache.jmeter.protocol.http.control" level="debug" />
You can do that with your favorite text editor. Don’t forget to restart JMeter to apply the changes in the log4j2.xml file.
This category (org.apache.jmeter.protocol.http.control) is responsible for logging events connected to the CookieManager, CacheManager, AuthManager and so on.
6. Restart JMeter and run the script again.
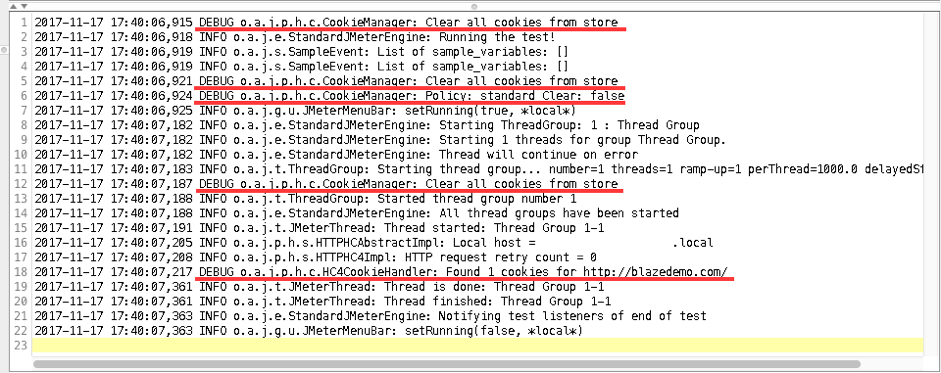
The log now contains information about events from the HTTP Cookie Manager config element. This is valuable if you need to debug problems with cookies, such as an SSLException Error. For example, if our script has a problem with passing cookies, we can add information about the Cookie to the log and this can help us localize the problem.
7. Uncomment another line of code in the log4j2.xml file:
<Logger name="org.apache.http" level="debug" />
This category (org.apache.jmeter.protocol.http.control) will enable full wire and context logging.
Wire logging is logging of all data transferred between the server and JMeter when executing HTTP requests. Use it only to debug problems, since storing all request and response data could take a lot of disk space.
Context logging is logging of information about the internal operations of the HttpClient when executing HTTP requests.
8. Restart JMeter and run the script again.
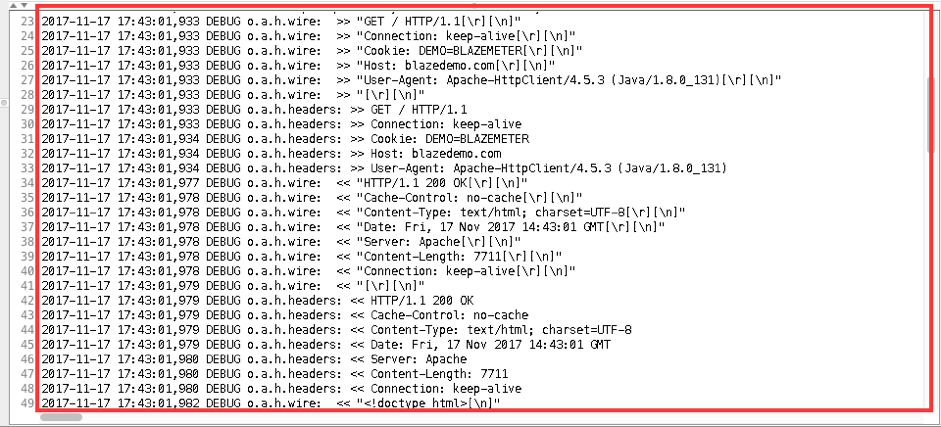
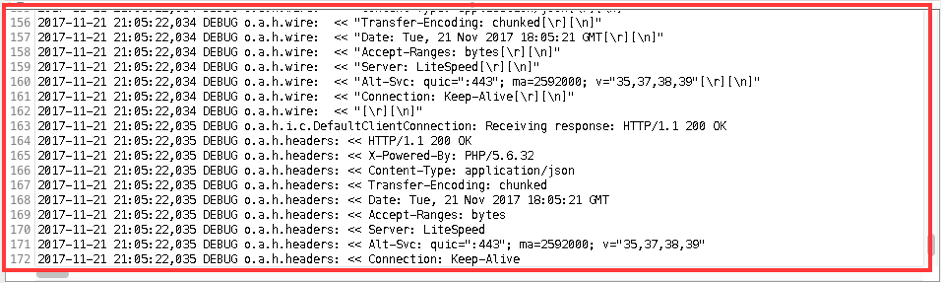
As we can see the log contains advanced information about the HTTP request.
Get the most out of your JMeter tests with BlazeMeter — the industry's most-trusted performance testing platform. Start testing for FREE today!
Option 2 - Changing the Configuration Using the Command line
Another way to change the log level for specific categories or for the root logger is to start JMeter with specific flags using the command line.
First of all, revert all changes in the log4j2.xml file so that we can try changing the configuration via the command line.
9. Restart JMeter and run the script again. After those manipulations your log should be clean again.
Overriding a logging setting for a particular category can be done by using the following option:
-L[category]=[priority]
Examples:
jmeter -Lorg.apache.jmeter.protocol.http.control=DEBUG
jmeter -Lorg.apache.http=DEBUG
jmeter -LDEBUG
10. Enable HTTP Controls logging. To do so, start JMeter via the command:
jmeter -Lorg.apache.jmeter.protocol.http.control=DEBUG
11. Run the script and check the log again.
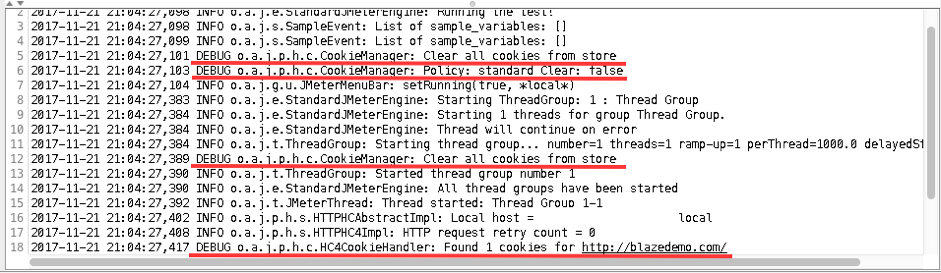
The log contains information about events from the HTTP Cookie Manager config element, same as in step 6 above.
12. Enabling full wire and context logging can be done with the following command:
jmeter -Lorg.apache.http=DEBUG
13. Run the script one more time.
The log contains full wire and context information as in step 8 of this blog post.
14. Changing the root logger configuration can be done with the -L flag, but without the category name. Start JMeter with the following command and check the log as in previous steps.
jmeter -LDEBUG
Option 3 - Changing the Log Level via Menu
The third way to change the log level is to use the Log Level menu of JMeter.
The latest version of JMeter has a few more log level options than the previous versions. Switching between these options will change the details in the JMeter log:
- ERROR - Includes information about error events from JMeter and during script run. Example of ERROR log message: 2017-12-07 16:57:01,895 ERROR e.l.j.w.PingPongSampler: Sampler 'WebSocket Ping/Pong': there is no connection to re-use
- WARN - Includes information about events to be warned about from JMeter and during script run. Also includes messages from ERROR log level. Example of WARN log message: 2017-12-07 16:58:56,825 WARN o.a.j.g.a.LogLevelCommand: Setting root log level: INFO
- INFO - Includes information about events from JMeter and during script run. Also includes messages from WARN and ERROR log levels. Example of INFO log message: 2017-12-07 17:39:10,332 INFO o.a.j.t.ThreadGroup: Started thread group number 1
- DEBUG - Includes information about debugging events from JMeter and during script run. Also includes messages from INFO, WARN and ERROR log levels too. Example of DEBUG log message: 2017-12-07 17:40:41,861 DEBUG o.a.j.p.h.s.HTTPHC4Impl: Thread Finished
- TRACE - Includes information about tracing events from JMeter and during script run. Also includes messages from DEBUG, INFO, WARN and ERROR log levels.
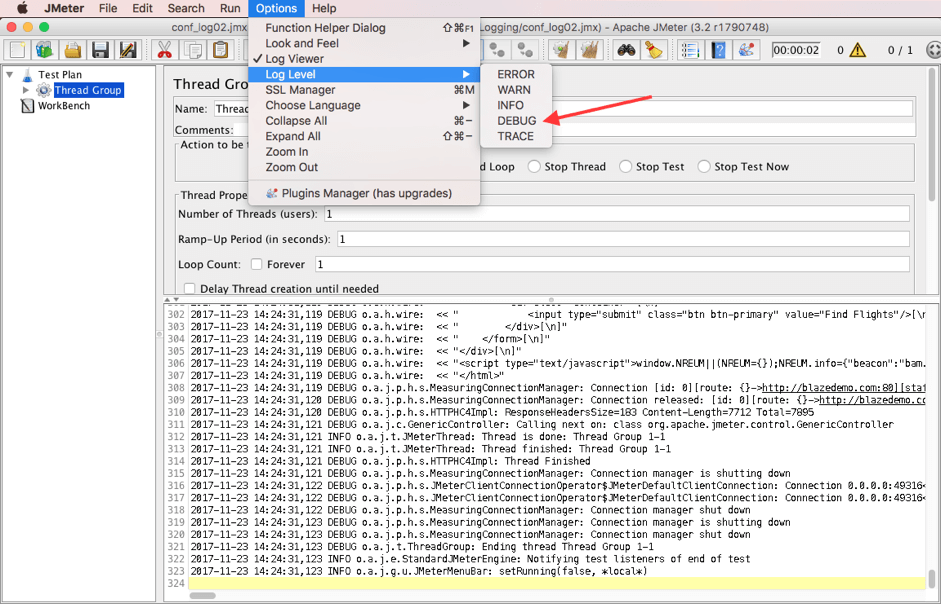
15. To change the log level to DEBUG via the menu:
Options -> Log Level -> DEBUG
A line mentioning setting the root level of the log will be added to the log.
2017-11-22 16:39:15,894 WARN o.a.j.g.a.LogLevelCommand: Setting root log level: DEBUG
16. Run the script and check the log.
The log should look similar to step 14 above.
Nice! We took a look at the various methods for configuring logging in JMeter. If you have any questions just let me know in the comments section below!
Learn more advanced JMeter from BlazeMeter University.