Blog
February 22, 2021

If you are looking for a test automation tutorial, you have come to the right place.
In this blog, we will start from scratch, go through recording functional and performance tests, automate those test executions in both simple and increasingly complex ways, and eventually scale our test suite using BlazeMeter's continuous testing platform. I will show you some interesting tools and use cases along the way, including Taurus, Jenkins and JMeter. At the end of this post, you will be able to record your own simple functional and performance tests and create basic automated pipelines, making use of best practices that will help as you expand your automated testing strategy.
To get the most out of this test automation tutorial, I recommend following along and replicating all that you can. Each tool we cover is freely available and can be installed fairly easily to be used on your local machine (aside from BlazeMeter, which isn’t a tool to be installed). I will try to provide resources for each, which will explain how to install and use them, but the details are outside the scope of this article. For this tutorial, I’ll be assuming you have some background knowledge on JMeter, Selenium, and testing in general, and some familiarity with Jenkins and GitHub will definitely help.
For a more in-depth take on this material, check out our online course “BlazeMeter Test Automation in Practice”, which you can find here.
Back to topTest Automation Tutorial: 6 Steps
There are six steps in this test automation tutorial. Jump ahead or follow along!
1. The Application Under Test
First, let me introduce the "application under test" for all of the performance and functional tests that we will run. This is the Digital Bank App. This app is convenient in that it gives us a number of obvious user flows with which we can test and play around. Note that you can build this app from source with instructions given here. But we will be taking the easier route and launching the application via docker.
Make sure that you have docker installed, then you can retrieve the docker image by running the following command (may require sudo privileges):
docker pull digisic/digitalbank
In order to run the application, use this command:
docker run -p <host_port>:8080 digisic/digitalbank
while making sure to replace with the port that you'd like to use to access the application.
Once the application starts up completely, you can get to the application by directing your browser to http://:/bank/login, so if you're running this locally on port 8080, you should go to http://localhost:8080/bank/login.
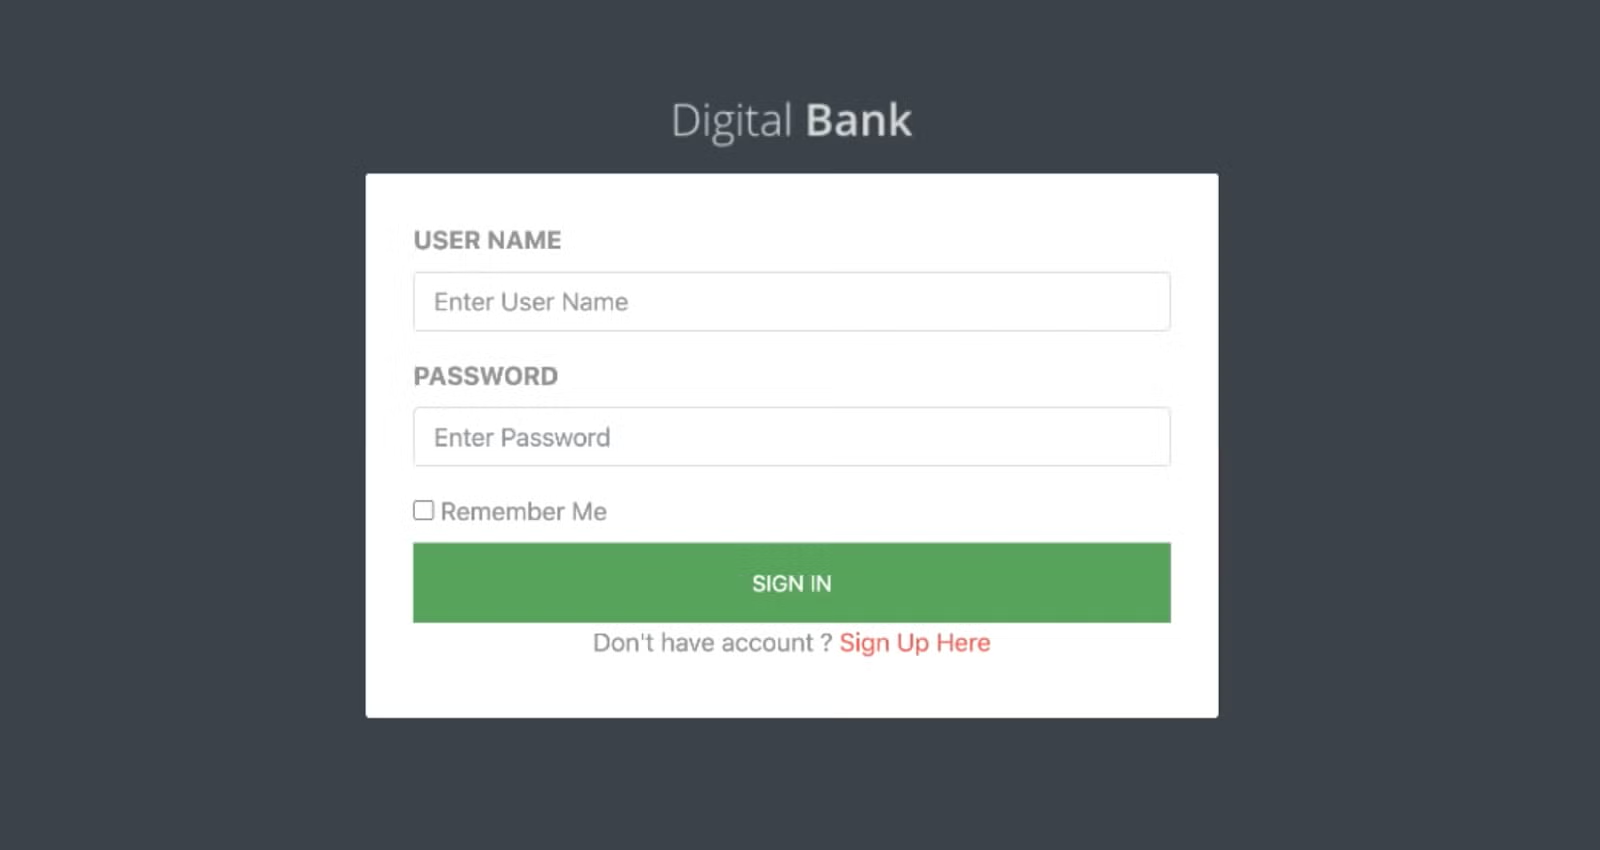
You should see a login screen like the following:
2. Test Data
Before we do anything else, let’s take an aside to talk about test data. Because we’re going to be automating this test, and the test case we have planned will require user login information, we should prepare some user data. We also need to make sure that this user data is available and can be used in our application.
Our application has an API that will allow us to add users with login credentials. Later on, our automated tests will use this same set of user data while testing the application. For this purpose, I’ve created some user data. Feel free to copy and paste into your own csv file, or come up with your own data in this format:
emailAddress,firstName,lastName,postalCode and save it to a file called users.csv.
john.johnston@demo.io,John,Johnston,72007
james.jameston@demo.io,James,Jameston,94203
joe.joeston@demo.io,Joe,Joeston,72008
jack.jackston@demo.io,Jack,Jackston,94203
jane.janeston@demo.io,Jane,Janeston,72009
jean.jeanston@demo.io,Jean,Jeanston,94203
janet.janetston@demo.io,Janet,Janetston,72010
julia.juliaston@demo.io,Julia,Juliaston,94203
josie.josieston@demo.io,Josie,Josieston,72011
jessica.jessicaston@demo.io,Jessica,Jessicaston,94203
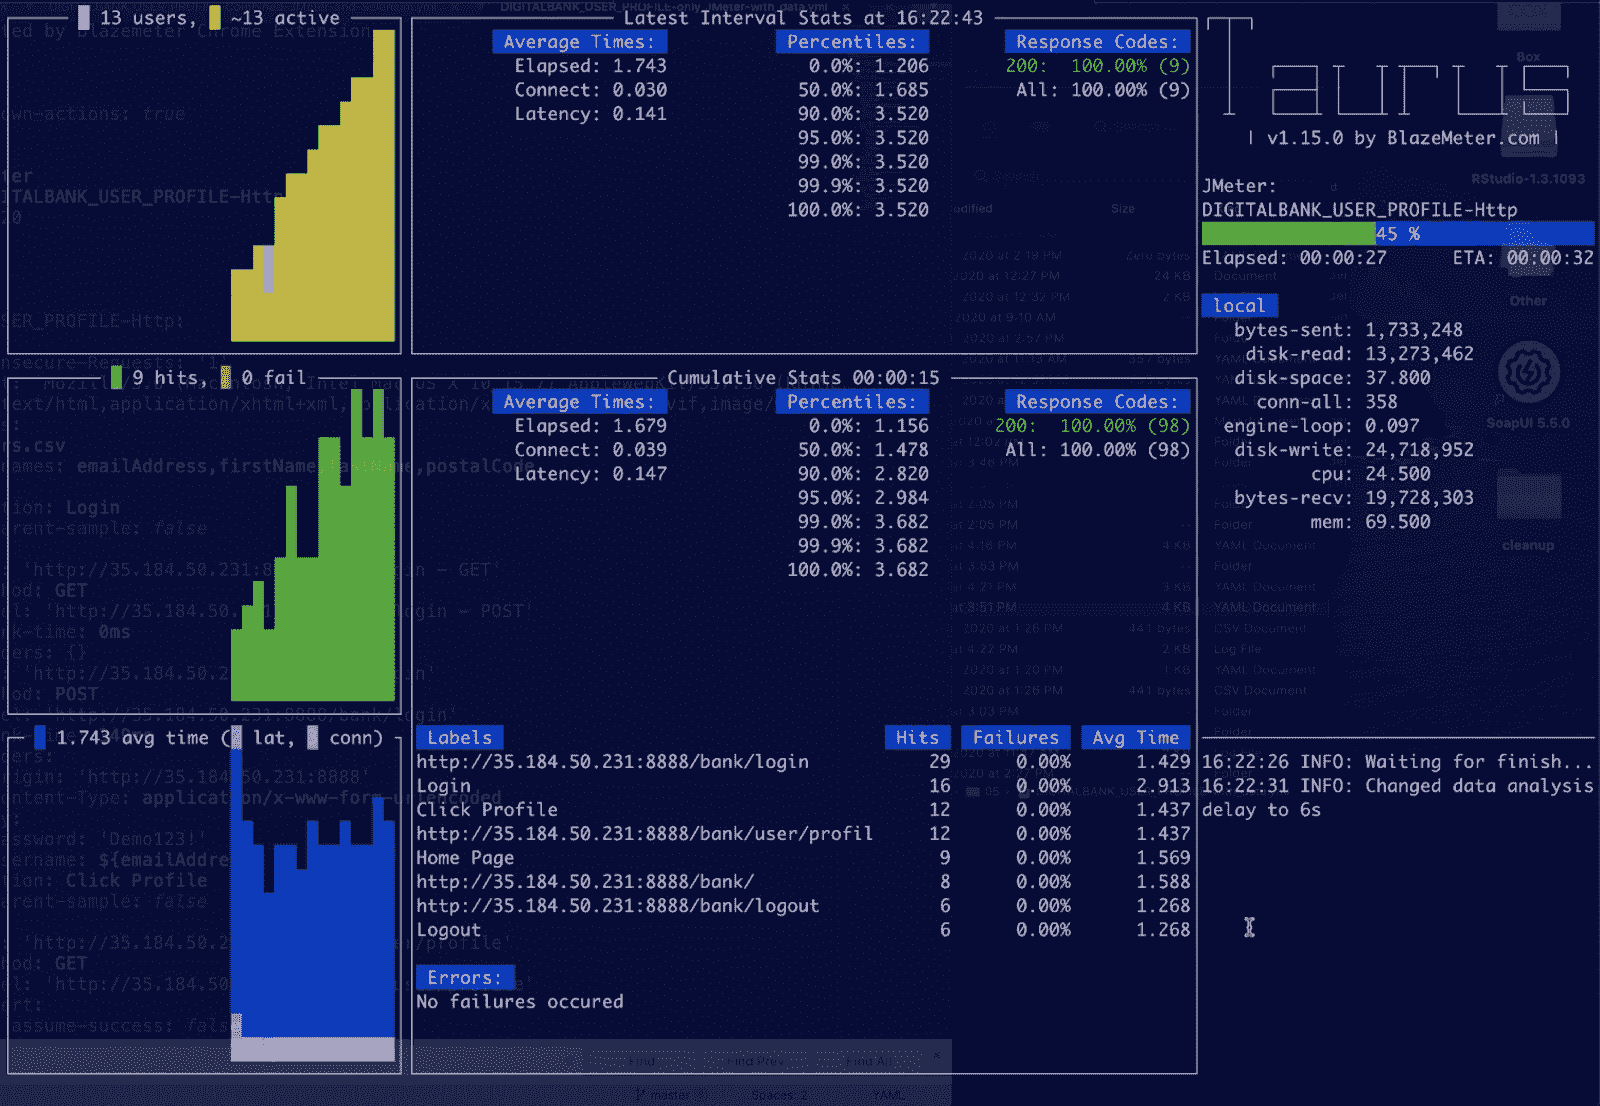
We’ll use this data in a prepared Taurus YAML configuration, which will add our users to the application. Taurus is an open-source, easy to use test automation tool. This is a great time to make sure that you’ve got Taurus installed and working on your local machine, we’re going to be using it a lot throughout our entire automated testing journey!
execution:
    - executor: jmeter
      scenario: CreateUser
      iterations: 10
      concurrency: 1
    scenarios:
      CreateUser:
        follow-redirects: true
        data-sources:
        - path: users.csv
          variable-names: emailAddress,firstName,lastName,postalCode
        variables:
          BASE_URL: http://:/bank
        requests:
          - url: '${BASE_URL}/api/v1/auth?username=admin@demo.io&password=Demo123!'
            method: POST
            label: 1. Authenticate API User
            headers:
              Content-Type: application/json
            assert:
             - contains:
               - '200'
               subject: http-code
               regexp: true
               assume-success: true
            extract-jsonpath:
              authToken: 'authToken'
          - url: '${BASE_URL}/api/v1/user?role=USER'
            method: POST
            label: 2. Create User
            headers:
              Authorization: Bearer ${authToken}
              Content-Type: application/json
            body: '{ "address": "HC-03 BOX 20665", "country": "US", "dob": "01/11/1923", "emailAddress": "${emailAddress}", "firstName": "${firstName}", "gender": "F", "homePhone": "7731418718", "lastName": "${lastName}", "locality": "Austin", "mobilePhone": "7731418718", "password": "Demo123!", "postalCode": "${postalCode}", "region": "AR", "ssn": "${__Random(100000000,999999999)}", "title": "Mr.", "workPhone": "7731418718" }'
            assert:
             - contains:
               - '201'
               subject: http-code
               regexp: true
               assume-success: true
As you can see, this configuration uses a CSV file, which should be in the same directory as the Taurus file. It is called users.csv and it takes each line in it as the variables emailAddress, firstName, lastName, and postalCode. We then use the local admin user in our Digital Bank application to add these users.
It doesn’t matter that everybody has the same mobile number and lives in the same region, we’re not being super rigorous here, we’re just showing off that we can essentially add new users in a simple way. Also note that the execution has 10 iterations, as we’re trying to add 10 users. If you’ve created more user data (maybe you want to see your own name in the application!), you may need to change the number of iterations to make sure every line in the CSV is utilized. To make use of this script, we need to run bzt .yaml in our terminal, where is whatever you’ve called the user management script above.
If the above script is a mystery to you, don’t worry about it too much, as long as you don’t get a bunch of errors when running it. You’ll have plenty of opportunities to get familiar with Taurus YAML while we’re recording and scripting our own scenario.
3. Recording Test Scripts
Before we talk about what we’re going to test in this application, make sure that you have the BlazeMeter Chrome Extension (and also that you’re accessing the application through Chrome, so you can use the extension!), because we’re going to use this to record our tests in one fell swoop.
So, let’s define a User Flow for our tests. First, note that in the logs created when running our application, we will get some demo user information.
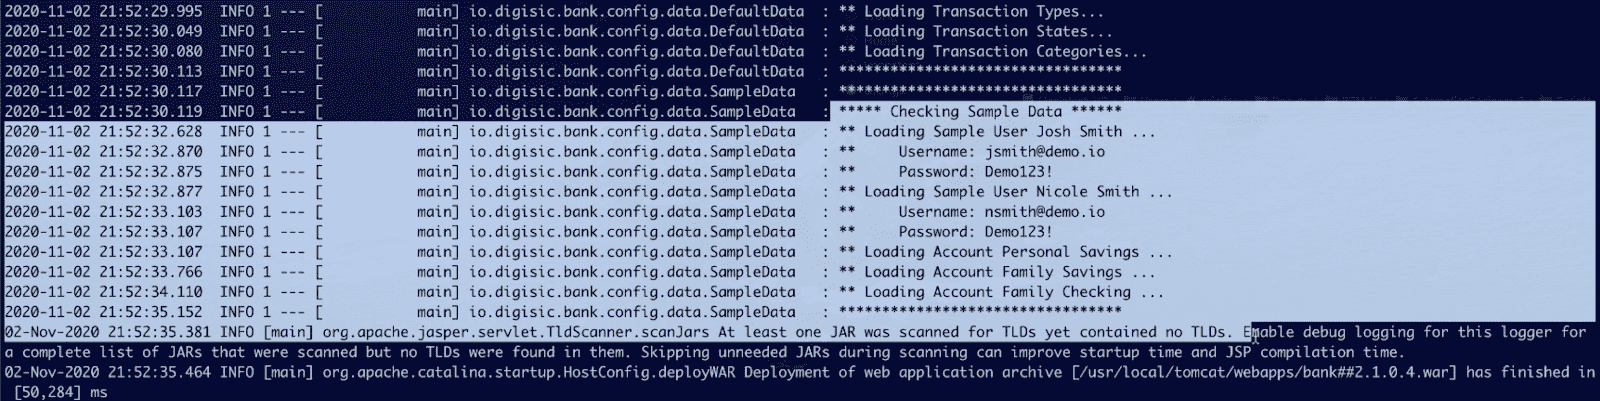
Use this to log into the application, you should see a screen like this:

This is a good time to note that you can set up transactions in the BlazeMeter Chrome Extension while you’re recording. Feel free to create a new transaction for each of the main parts of the test. My transactions will be “Login”, “Click Profile”, “Home Page”, and “Logout”.
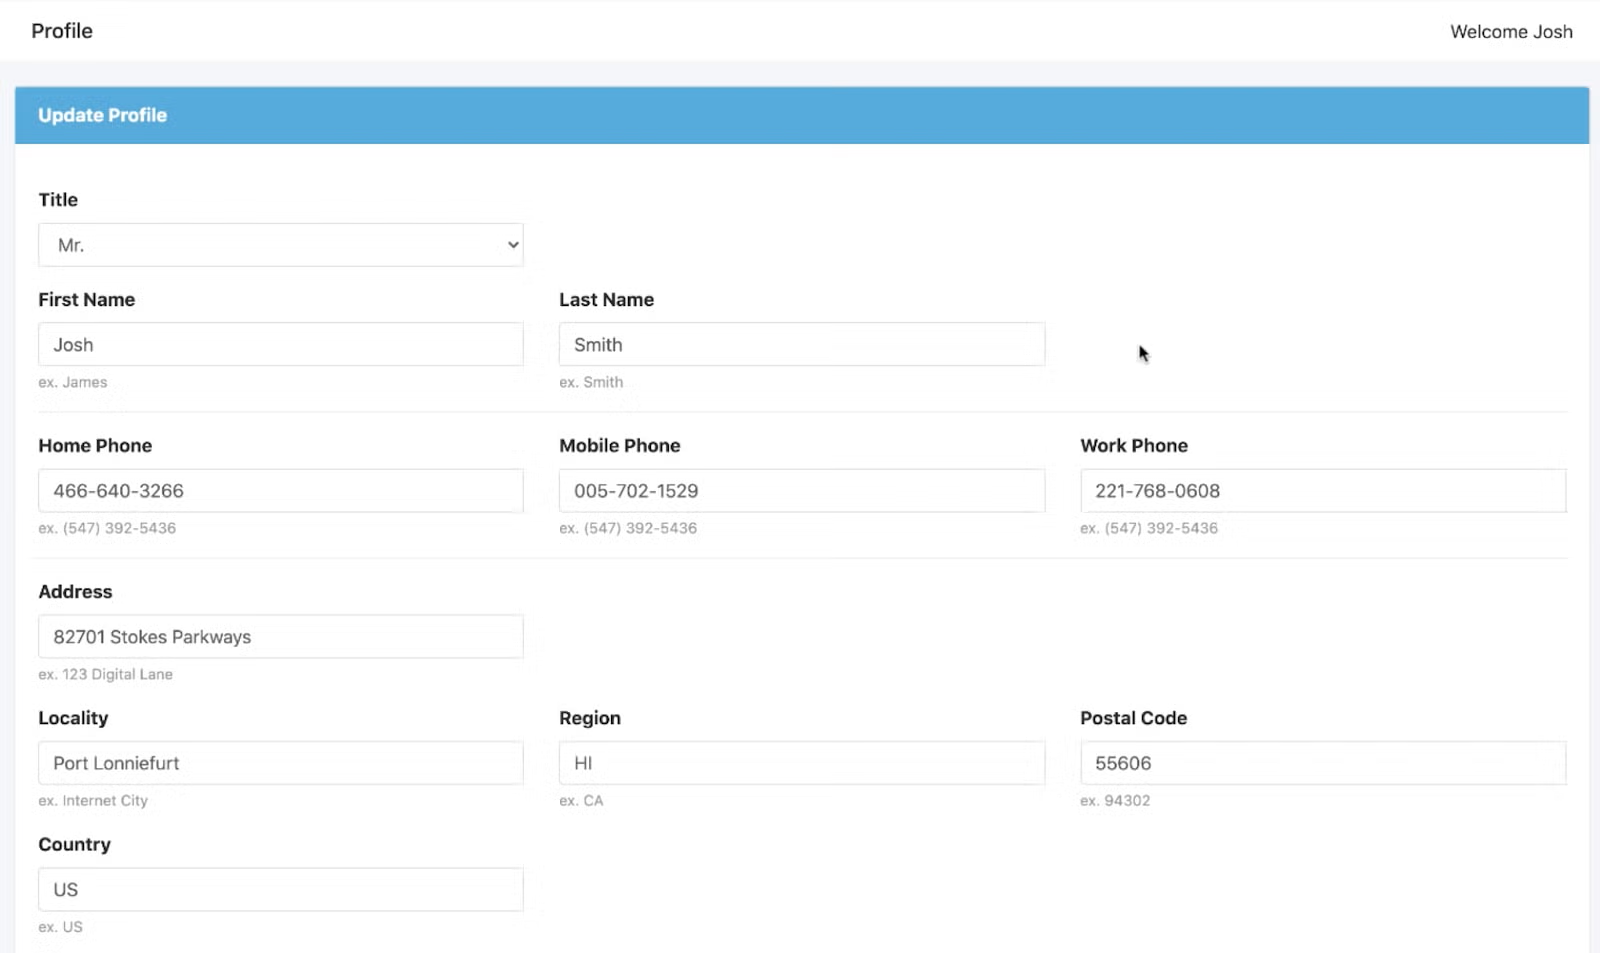
Once we’ve logged into the application, our user flow will take us to the user profile page. Click on the user’s profile picture, then click on “My Profile”.
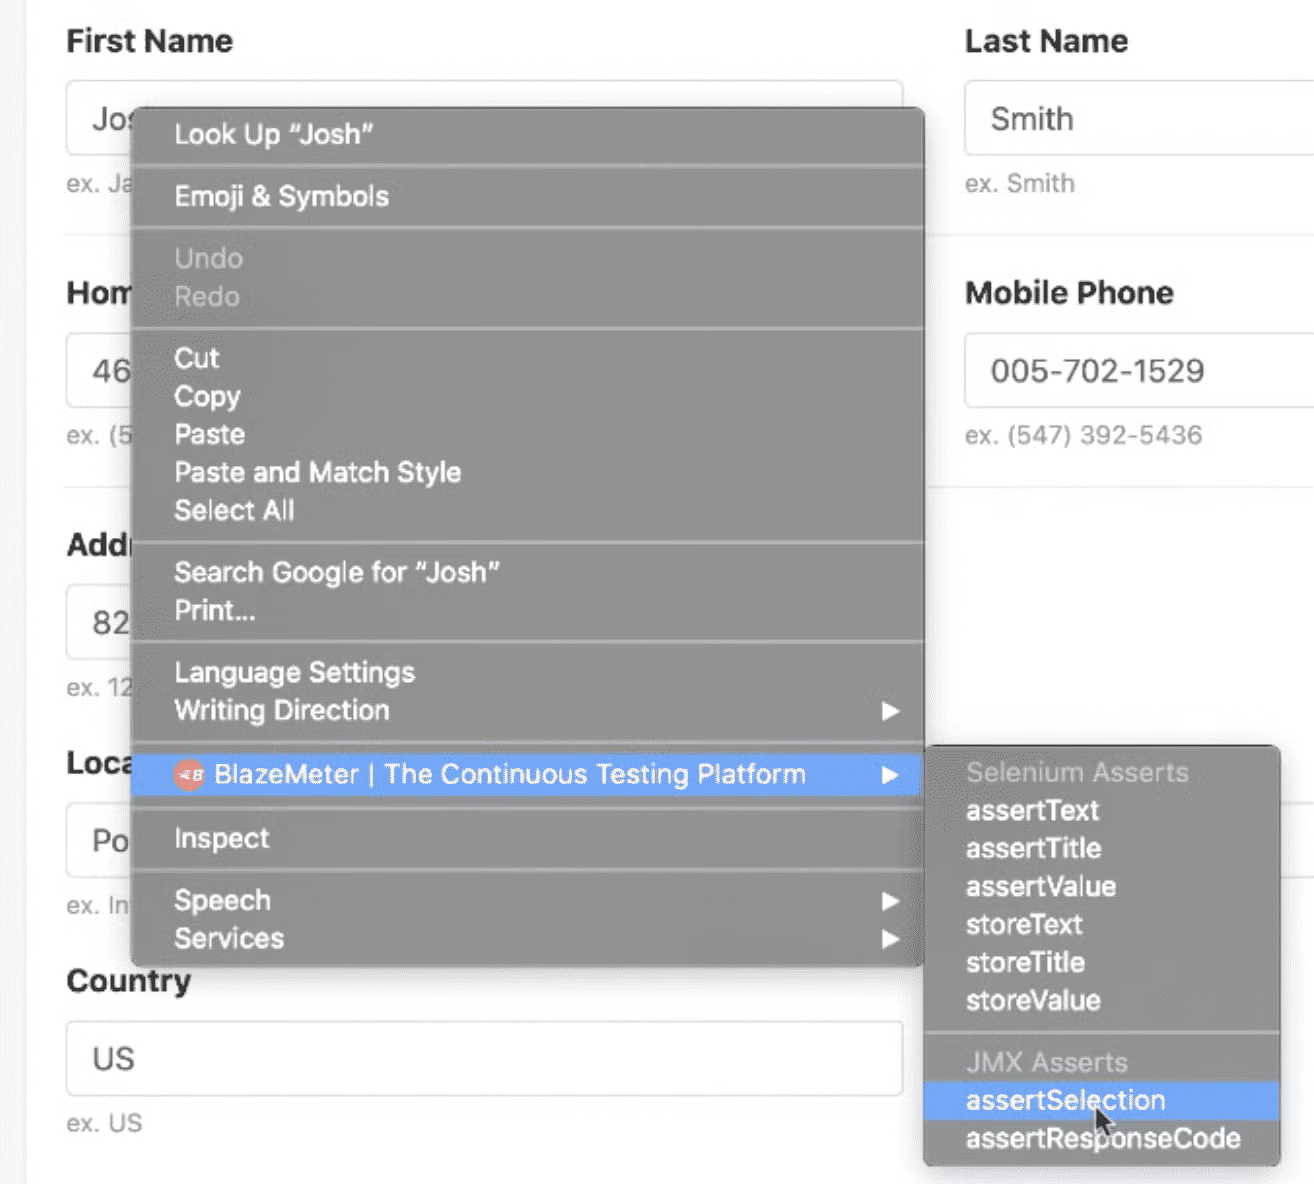
An important aspect of automated testing is making it so your tests give you useful feedback about your test scenario. We’re going to do that through assertions. So highlight and right-click on text present in the “First Name” field. Go to the section of your right-click menu associated with the Extension and assert the selection for the JMX. Then let’s go ahead and do this for the “Last Name” field as well.
Next, let’s go back to the home page, and then finally log out. Once we’ve logged out, we can create another assertion to verify that we’ve successfully logged out.
Export the script from the extension as a combination JMeter and Selenium YAML. This way we’ve just recorded two scripts for the price of one.
Provided that we have Taurus installed and configured on our computer, we can run the script in our terminal just using bzt .yaml, super easy.
4. Version Control and Continuous Integration
If you want to follow along for this next bit, you’ll need to have Git and Jenkins installed, and you’ll also need a GitHub account. First, create a new repository on GitHub, and follow the instructions there to sync a folder on your computer with the repository. After you’ve initialized git and connected to the remote repository, there are only a few more commands that’ll get you where you need to go with git.
To add all new changes in the directory:
git add -A
To commit the changes you've added:
git commit -m ""
To push the changes to the master branch of the repo:
git push origin master
Once we’ve got the tests that we want to be automating in our GitHub repository, we can take a look at Jenkins. The easiest way to get started once we’ve got Jenkins installed and we’re logged in, is to click on “Create Item” and then select “Freestyle Project”. Now, choose a name for your project. There are many different projects and items you can make here, but this is the quickest way to get up and going.
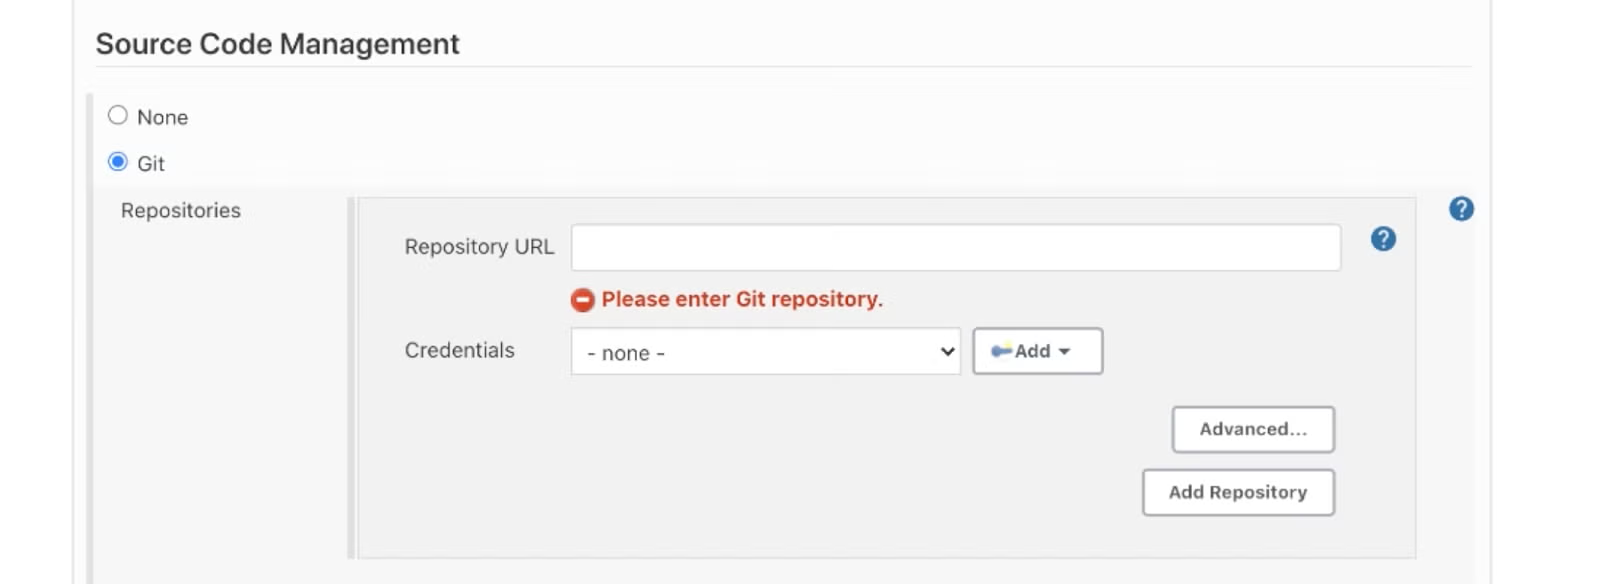
Once you’re at the configuration page for your project, scroll down to the Source Code Management section, and select Git. You’ll just need to provide the GitHub URL of the repo you’re using and credentials that will allow you to access the repo, if necessary. If you haven’t already set up the credentials in Jenkins, you can click the “add” button next to where you select credentials.
5. Our First Automation and Testing with Data
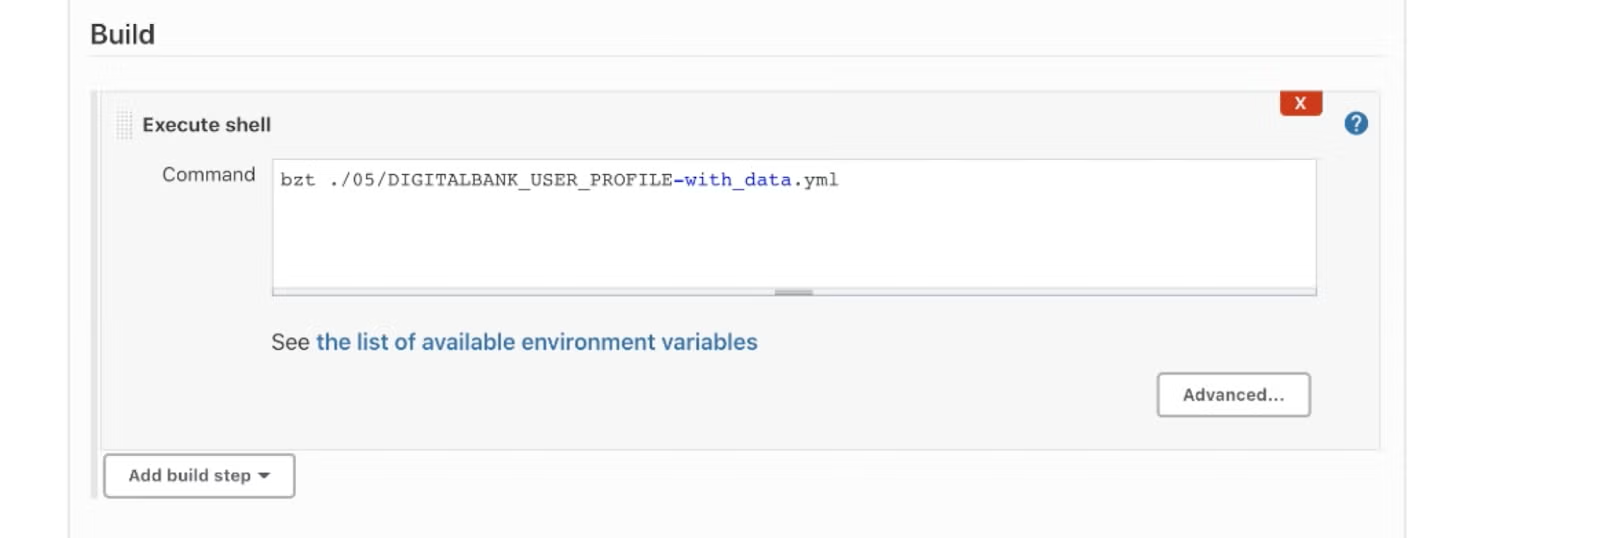
Now we’re most of the way to setting up our automation framework! To finish up our simple Jenkins project, we’re just going to add a build step called “Execute shell”. In this field we just need to put the command that we would use in our terminal when running this Taurus test.
bzt path/to/file.yaml
Once we’ve got that set up, we can save our project, and select “Build Now”. This will start the process of running through our project, collecting our test files from GitHub, and using Taurus to run the test configurations.
Note that the system user that’s running Jenkins needs to have the necessary permissions on your computer to run Taurus for this process to work correctly. The simplest way to accomplish this is to install Jenkins and Taurus in the same way. For instance, on MacOS, installing both Jenkins and Taurus through homebrew will ensure that Taurus can be utilized by Jenkins.
An alternative to using Taurus through the Execute shell build step would be to add The Performance Plugin to Jenkins, and replace the Execute shell step with the Performance Test build step. This plugin uses Taurus behind the scenes, so you can make use of the test files we’ve created in the same way we did above.
Now that we’ve set up our Jenkins project to pull the most updated test files from our GitHub repo and run them using Taurus or The Performance Plugin, let’s enhance our test a bit. We made a point to create test users in our application, so let’s make good on that preparation by making it so our test utilizes this data.
Take the data sources section of our user management script:
data-sources:
        - path: users.csv
          variable-names: emailAddress,firstName,lastName,postalCode
And add it to the JMeter (HTTP) scenario in our test yaml. Then we just need to replace the instances of email address, first name, last name, and postal code in our test script with the appropriate variables, for example ${emailAddress}. Note that if you recorded the same scenario that I did above, the postal code won’t show up in your test script. As an added exercise: can you add another assertion to verify the postal code matches for each user?
After you’ve made the changes and verified your test script is working the way you want it to, make sure that you push any changes you’ve made to the GitHub repo. Now, the next time we build our project in Jenkins, our tests will run with the data we’ve set up here.
You can remove that extra step of having to go and build the project by either setting up GitHub to send a webhook notification to your Jenkins installation, or (more easily) by having Jenkins poll GitHub for changes to the repo.
If either of these options are set up, then running a performance test is as simple as committing changes to the test configurations and pushing them to GitHub. The processes we’ve put into place up to this point will take care of the rest. Congratulations, you’re automating!
6. Enhancing Test Automation: Next Steps
We’ve laid out a simple framework to get started automating tests. But there’s still a lot to think about in terms of how we could enhance this process. In conclusion, I’m going to cover a few of the more useful steps you might take to make automating your tests really useful. Use these to expand your test automation abilities, whenever you feel ready.
Making use of CI Build Status
One of the reasons we built our tests in Taurus is because of its flexibility in reporting. If we add in the Pass/Fail reporting module to our Taurus configuration file, we can determine under what conditions our test will fail. For example, if we don’t want to accept any errors, or if we want our test to fail if the average response time is too high, we can set that up here.
This becomes useful for our purposes when we realize that Taurus’s exit code changes if our test fails. Jenkins knows how to interpret the exit code, at least to a basic extent, which will give us immediate feedback on whether our tests are passing or failing, just by looking at the build status in our Jenkins dashboard.
Sequencing CI Builds
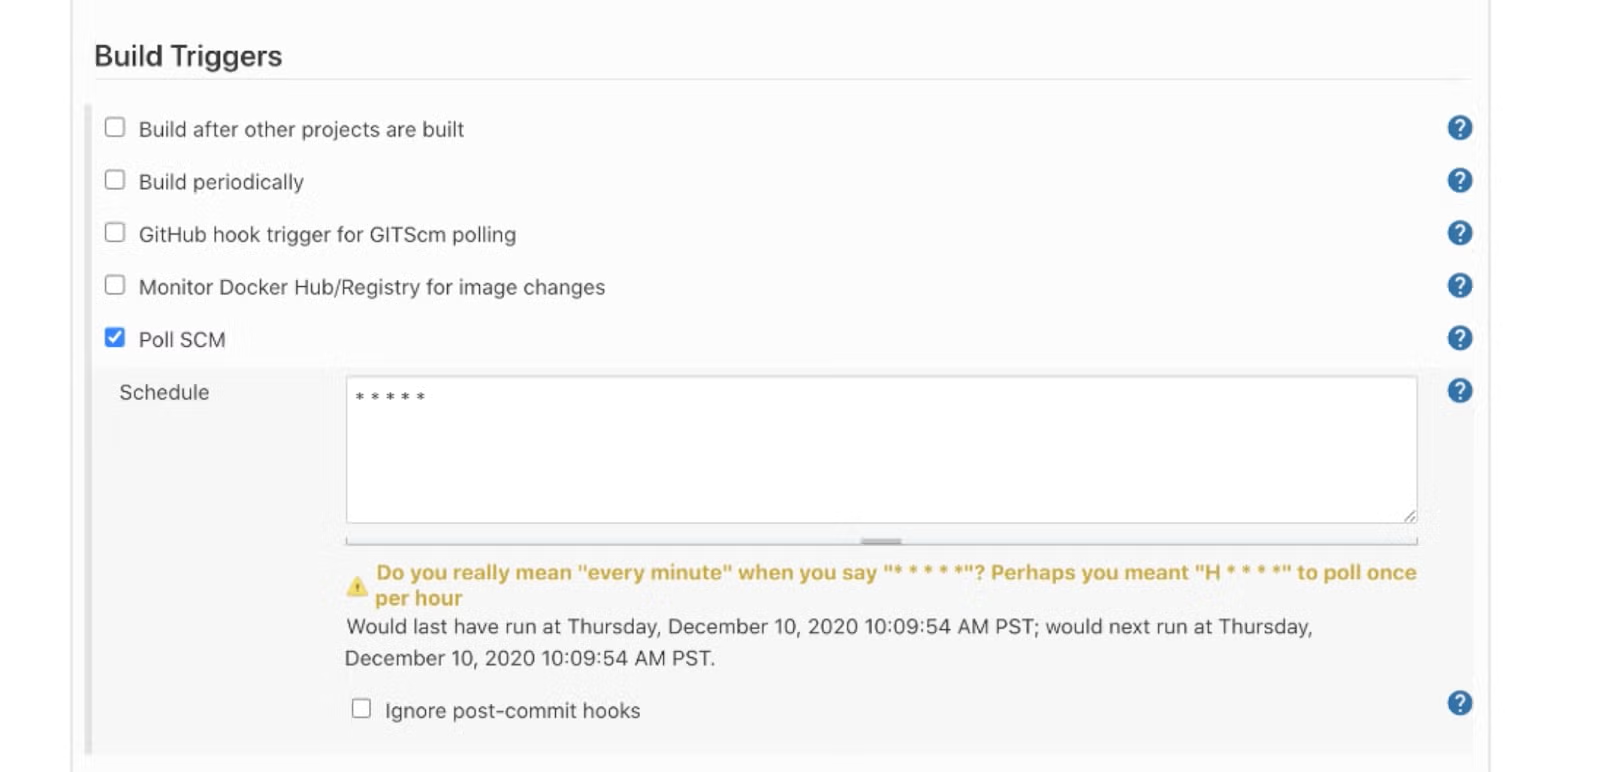
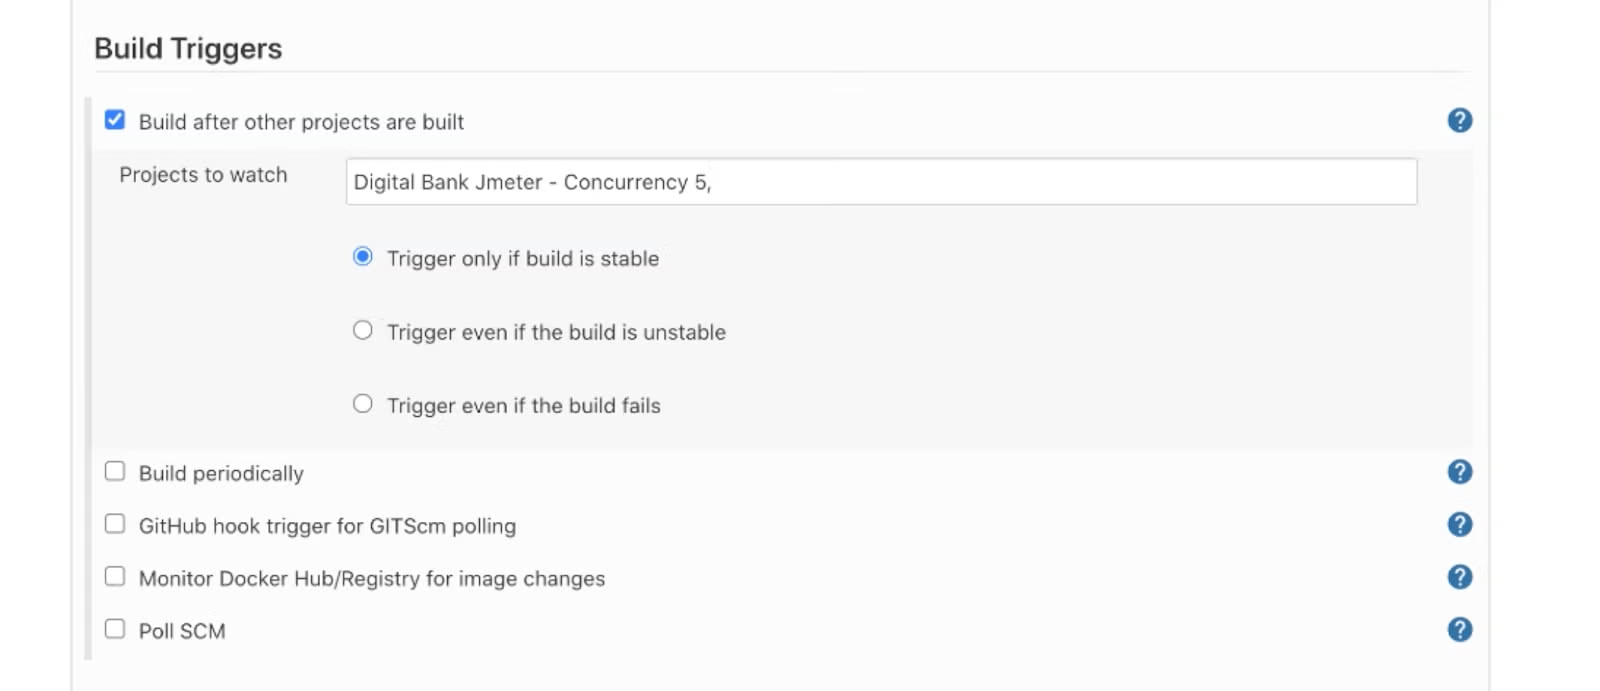
One of the most powerful and flexible aspects of CI tools are build triggers. These determine when a particular project is built. On the surface, this is just a way for us to start building a project from the outside (for example, when new code is pushed to a remote repository). But another use of build triggers is to link together different projects so that one is built after another. In Jenkins, you can add build triggers to a project on that project’s configuration page, under the (appropriately titled) Build Triggers section.
The obvious use case is after application code is built: you can have build triggers set so that your tests can start running. But these are especially handy when considering running performance tests, because it’s unlikely that we’ll only want to run a single performance test to validate the newest version of our application. Instead, we’ll want to run many and at varying levels of load.
Separating our performance test into different Jenkins projects, one for each level of load (1 virtual user, 100 virtual users, 1000 virtual users, etc), and using build triggers to build them in order of concurrency level will automatically give us visibility into the point where our application starts to see performance degradation. This is a natural and inherent benefit to well-defined automated testing.
Modularizing Test Scripts
One thing that we should recognize is that our test scripts are written as Taurus test configurations, and so all the benefits of Taurus can be utilized in our automated testing. A simple example of this is the ability to modularize our test scripts. Take a look at the script below:
execution:
    - executor: jmeter
      scenario: modular_scenarios
      concurrency: 5
      ramp-up: 5s
      hold-for: 20s
    scenarios:
      modular_scenarios:
        requests:
        - include-scenario: DIGITALBANK_Login
        - include-scenario: DIGITALBANK_User_Profile_Performance
This test configuration relies on including modular scenarios (which you can create yourself by breaking up the scenario we recorded above into smaller self-contained scenarios, like one that only includes the login transaction). The example above is a performance test that goes through the “user profile” flow we defined earlier, but with the login section stripped out into its own modular scenario.
By running the test configuration above with bzt along with files containing whatever smaller scenarios you reference, Taurus will compile them into one configuration file. This will create one effective test file out of your modular test components.
The main benefits here are (1) any new test I define that requires logging into the application can include the modular login scenario, meaning I don’t have to script it again, and (2) if the login flow for this application ever changes, I only have to maintain one copy of that modular login scenario and the rest of my tests can inherit that change.
The usefulness of modularizing tests scripts isn’t exclusive to automation, but we tend to create more and more complex testing strategies when we begin automating our tests. Modularity can bring much needed simplicity and flexibility back into the fold.
Back to topScale Your Test Automation Tutorial With BlazeMeter
Once we’ve got our tests set up to automate in the way that we want to, we’re eventually going to hit a wall on the level of concurrency for the performance tests we can run locally, or we want to have better visibility in reporting for our tests. This is where BlazeMeter comes in, as a continuous testing platform that scales performance tests scripts (among other things).
Taurus lets us run our tests on BlazeMeter by just adding “-cloud” to the end of the bzt command we use in our terminal (this will also work if you’re using the Performance Plugin). Do note that you’ll have to set up your BlazeMeter API key with Taurus to be able to do this.
But even if you’re not running your tests from Taurus (maybe you’ve already defined your tests on BlazeMeter), you can start these tests in a few different ways. From Jenkins, the easiest way is to use the BlazeMeter Plugin for Jenkins. But no matter what tools you’re using, the BlazeMeter API will always provide a flexible way to start tests and get your results. These APIs can be utilized in Jenkins Pipeline Scripts written in Groovy, or can be executed from shell using readily available tools like cURL.
For deeper insights into how teams worldwide are scaling their testing strategies and overcoming quality challenges, check out the Global Quality Application Survey to benchmark your organization's approach.
Back to topConclusion
There will always be more that we can say on the topic of automation, but following the exercises described in this test automation tutorial will give you a feel for some of what you can accomplish, and set you up to experiment and find the path to an automated testing strategy that works for you.