Blog
April 18, 2023

In today’s fast-paced world, users’ tolerance for waiting has declined. If a website takes a long time to load or crashes in-between pages, they tend to switch to another site, maybe even a competitor’s. This would be a huge loss, so this is where performance testing plays an important role.
Performance testing is a process that QA or developers perform to evaluate the system’s responsiveness, speed, scalability, stability, throughout, and overall behavior under a variety of conditions. To ensure that apps perform seamlessly, it is essential to measure performance testing metrics. In this blog post, we’ll explore which metrics those are.
Let’s start with metrics in general.
Back to topWhat are Test Metrics?
Test metrics are a set of quantifiable measurements or statistics that are used to evaluate, compare, and track performance, processes, and progress in different areas of a business or operation. Metrics can be used to provide objective insights and data-driven analysis that helps in decision-making, problem-solving, and identifying areas for improvement.
Picture this: you are the owner of a bakery and you want to track your employee’s performance to ensure that your customers are getting top-notch service. Now, this can’t be reviewed based on intuitions or guesswork. Instead, you need to use metrics to measure their performance and identify the area of enhancement.
For example, you can track how quickly they serve the baked goods, how they greet the customers, how often they get the order down correctly, how they offer more products to customers for upselling, how they handle takeaways and deliveries, and how quickly they resolve any queries. By tracking these metrics, you will get an accurate idea of what area of improvement they have to focus on.
Now let’s apply this notion to software testing metrics.
Back to topWhat are Software Testing Metrics?
Software testing metrics are qualitative measures used to evaluate the quality of the software being tested and allow visibility into the product's readiness. These metrics are like little spies that help us keep an eye on different aspects of the testing process.
For example, metrics can include measures such as the number of bugs found, the percentage of code that has been tested, and the time taken to complete testing. By monitoring and analyzing these metrics, you can identify trends and patterns that can help you optimize your testing efforts and ensure that you're not missing any critical pieces of code.
Back to topWhy are Performance Test Metrics Important?
Performance testing metrics are a subset of software testing metrics only that are used to assess the performance of software systems under load to ensure software quality.
Here are some reasons why performance testing metrics are important:
- Performance metrics can help identify bottlenecks, determine the overall health and reliability of the system, and inform decisions about improvements.
- Performance metrics help in prioritizing testing efforts based on criticality and usage scenarios.
- Performance metrics can help evaluate the scalability of the system or application under test, which is required to determine whether the system can handle an increasing number of users, transactions, or requests.
- Performance metrics can establish baselines for system performance under normal and expected loads.
- Performance metrics can provide information on the resource utilization of the system or application, such as CPU usage, memory consumption, and network usage.
- Performance metrics analyze the performance of third-party systems or APIs that are integrated with the software system.
Key Performance Test Metrics
These are the most commonly used and informative performance testing metrics:
Response Time
Measures the total time it takes a system to respond to a user request. It is one of the most critical metrics as it ensures systems are responsive and are meeting user expectations. There are 4 subcategories of response time:
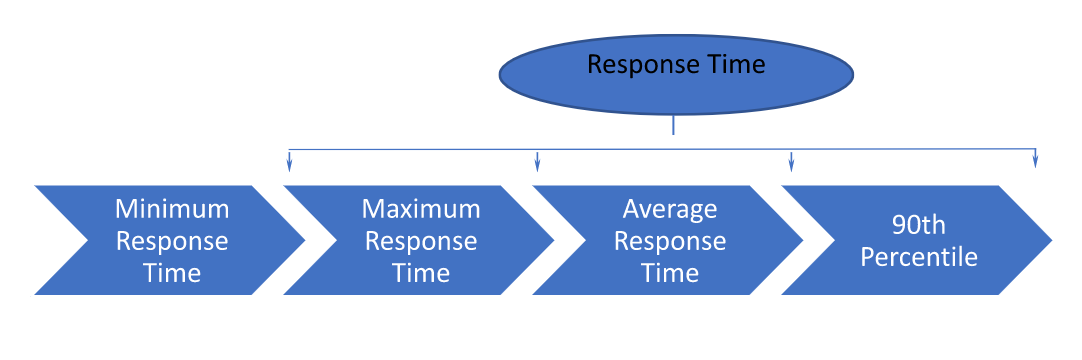
Minimum Response Time
Measures the shortest amount of time the system takes to respond to a user request. It represents the best-case scenario.
Maximum Response Time
Measures the longest amount of time the system takes to respond to a user request. It represents the worst-case scenario.
Average Response Time
Average response time = Total response time / Number of requests
Measures the sum of all the response times divided by the total number of requests. It represents the typical response time the user will experience.
90th Percentile
90th percentile response time = Average response time corresponding to the fastest 90% of requests
It represents the time required for 90% of requests to be completed successfully.
For e.g. Let’s say we are testing an e-commerce application’s ‘pay now’ feature. Now we want to measure its response time. We can perform a load test with 100 virtual users each performing ‘pay now’. After the test, we analyze the results and find that the 90th percentile response time for the pay now feature is 3 seconds. This means that 90% of the pay-now requests were completed on average within 3 seconds. The remaining 10% of pay-now requests took longer than 3 seconds on average to complete.
Throughput
Throughput = Total no. of requests/ Total time taken
Measures the number of requests that can be processed by a system in a given time. It is generally measured in units of bytes per second or transactions per second.
Error Rate
Error Rate = (Number of failed requests / Total number of requests) x 100
Also known as an error percentage. It measures the percentage of requests that failed or didn’t receive a response. It is an important metric because it identifies the issues and bottlenecks that affect the performance of the system.
CPU Utilization
CPU utilization (%) = (1 - (Idle time / Total time)) * 100
Measures the percentage of CPU capacity utilized while processing the requests.
Memory Utilization
Memory utilization (%) = (Used memory / Total memory) * 100
Measures the amount of memory that is being used by a system or application, compared to the total amount of memory available.
Average Latency Time
Latency = Processing time + Network transit time
Also known as plain “latency”. It measures the amount of time it takes for a system or application to respond to a user’s request. It is generally measured in milliseconds.
Network Latency
Network Latency = Time taken for response - Time spent
Also known as ‘network delay’ or ‘lag’. It refers to the delay that occurs during data transmission over a network. It can be caused by various factors such as distance between the sender and receiver, limited bandwidth, and the type of network technology used.
Wait Time
Wait time indicates how much time elapses from the moment a request is sent to the server until the first byte is received.
Wait time can be viewed from both perspectives i.e., from users and applications.
Wait time = Response time - Processing time (user’s perspective)
From the user's perspective, the wait time is the time spent waiting for the system to respond to their request. For e.g., time taken to load a page, perform a search, or complete a transaction.
Wait time = Processing time - Queue time (application’s perspective)
From the application's perspective, the wait time is the time taken by the system to process a user request after it has been received. For e.g. network latency, resource contention, or database performance issues.
Concurrent User Capacity
Refers to the maximum number of users that can use a system or application simultaneously without degrading performance or causing errors.
Transaction Pass/Fail
Transaction pass = (No. of successful transactions / Total Transactions) x 100%
Transaction pass occurs when a transaction has been completed as expected without any error or delay.
Transaction fail = (No. of failed transactions / Total Transactions) x 100%
Transaction failure occurs when the transaction is initiated and attempted to complete, but fails due to some error. For example, a user enters incorrect payment details, which causes the payment to fail.
Back to topUnderstanding the Different Categories of Performance Test Metrics
Performance testing metrics can be categorized into two types, namely;
- Client-side metrics
- Server-side metrics
Let us understand what both terms mean and what they include.
Client-side Metrics
Client-side metrics are measured on the client's or end-user device's side. This includes data collected from the user's browser, device, or other similar software components like third-party tools, such as Google Analytics, New Relic, or Pingdom. These metrics help understand how the application or website performs from the user's perspective. They can include data such as page load times, rendering times, resource loading times, and other similar measurements. By analyzing client-side metrics, developers and testers can identify potential issues that may affect the user experience and take necessary steps to optimize application or website performance.
Some of the key client-side performance testing metrics are mentioned below:
KPI Metric | Description |
Time to First Byte (TTFB) | Evaluates the time it takes for a browser to receive the first byte of the response from the server after sending the HTTP request. |
Page load time | Refers to the time it takes for a web page to load completely in the user's browser. Some of the page load testing metrics include Load time in seconds, no. of requests, Caching Rate, Speed index, Compression ratio, etc. |
Rendering Time | Measures the time it takes for a browser to render a web page after it has been received from the server. It also focuses on how long a user has to wait until the page is loaded and ready to interact. |
Time to Interact (TTI) / Navigation time | Measures the time it takes for a user to navigate between different pages or sections of a website or application. It is an important metric as it directly impacts the user’s engagement. |
Conversion Rate | Measures the effectiveness of a website or application in converting visitors into customers or achieving specific goals. Some of the common conversion rate metrics are Bounce Rate, Time on site, Exit Rate, Conversion Funnel Analysis, etc. |
Click-through rate | Measures the number of times users click on a specific link, ad, or call to action relative to the times the link or ad was shown. |
Server-side metrics: Server-side metrics measure the behavior and characteristics of the server-side infrastructure or the backend of the software that delivers the web application. This includes CPU utilization, disk I/O, etc. They are important because they give insight into the performance of a system and help to identify performance bottlenecks and other issues that may be slowing down the web application and impacting the user’s experience
Some of the key server-side performance testing metrics are mentioned below:
KPI Metric | Description |
CPU Utilization | Measures the amount of CPU time spent by the server in processing requests. High CPU utilization can indicate that the server is under heavy load, which leads to performance degradation or a system failure if overloaded for a long time. |
Memory Utilization | Measures the amount of memory the server uses to store and process requests. It is an important metric because it directly impacts the server's ability to process requests. High memory utilization can cause performance issues such as slow response times, application crashes, etc. |
Disk Capacity | Measures the total amount of storage space available on a physical or virtual disc drive. It is usually measured in bytes, kilobytes, megabytes, and gigabytes. |
Disc I/O (Input/Output) | Refers to the rate at which data is read from or written to a disc storage system. It measures how much data can be transferred to or from a disc storage device in a particular amount of time. |
Implementation of Performance Testing Metrics
To thoroughly understand the implementation of Performance testing metrics, let's go through some use cases.
Scenario: Suppose a company has an e-commerce website that allows users to purchase products online.
Use Case 1: Customer is having an acceptable user experience.
In such cases, where the user is not facing any issue with the response time under normal traffic conditions and during peak traffic hours, then we don't really need to investigate any further, as the customer is having a smooth user experience.
Use Case 2: Customer is facing persistent performance issue(s).
In such cases, we need to confirm if the issue is from the client side or the server side. Now to rule out the Client side first, we can test if the web application works well in different browsers and versions, as some web applications may not be optimized for certain browsers, which could cause performance issues, or if the cache is enabled and configured correctly, as incorrect caching can lead to excessive server requests and reduce the application's overall performance.
If we are good with cache and browser, we can look for any JavaScript errors on the page, which can result in slower page loading times and lead to an unresponsive UI. We can also test if the user's browser has any plugins or extensions that could be causing performance issues, as some plugins may consume excessive resources or interfere with the application's normal functioning.
Now, if everything looks fine at the client's end, then we can rectify the issue on the server side. For such cases, we can test if database calls might be taking excessive periods of time, this could be an indication that proper indexing needs to be considered or database design needs to be restructured. Additionally, we can test if there are any backend calls to a database or a web service that the application is dependent on which might be causing the ultimate slowness to the customer. Or otherwise, the delay in server response time may be because of server load, network latency, or inefficient server-side code. We can also test for API response time as well which can significantly impact server-side performance. If there is nothing wrong with such metrics, we may need to test if the server is running low on memory which may slow down the response time or even crash the server. We can further check if there are any memory leaks that occur when objects are not properly released after they are no longer needed, leading to memory usage that gradually increases over time.
Apart from all this, even the server's overutilization of resources, such as CPU or disk, can affect memory utilization and slow down the server's performance.
Use Case 3: As the number of users load rises, the application's memory usage also rises
This is one example where garbage collection can cause temporary performance issues in a web application with a large number of concurrent users. As the number of users rises, the application's memory usage also rises, and if garbage collection is not configured correctly, it can lead to Full GC cycles that can temporarily slow down the application.
For example, let's say a web application has 1,000 concurrent users, and during peak hours, the application's memory usage exceeds the allocated memory limit. In this scenario, the JVM may need to frequently perform Full GC (Garbage collection)cycles to free up memory, which can cause temporary performance issues such as slow response times and high CPU usage.
To address these performance issues, we can monitor the application's memory usage and configure garbage collection parameters based on the workload. We can improve the application's overall performance by tuning the garbage collection parameters to reduce the frequency and duration of Full GC cycles.
Back to topConclusion
Performance testing metrics are crucial for the QA and Dev teams in assessing the performance, scalability, and reliability of software or application. Whether you’re testing a mobile application, web application, or any other type of software using the combination of client-side and server-side metrics, organizations can identify performance issues, bottlenecks, and areas of improvement. This can optimize their applications to provide the best possible user experience, ensure customer satisfaction, reduce downtime, and potentially increase revenue.
BlazeMeter provides testers with metrics after running tests so they can track and monitor test results. Start testing now to see your own test metrics.