Blog
July 16, 2021

While there are many self-explanatory parameters responsible for load distribution (like ‘Number of threads’, ‘Loop Count’ or ‘Duration’), one of them might not be so simple to understand at first sight, and the appropriate value for this parameter might not always be obvious. This parameter is called ramp-up in JMeter.
In this article, we are going to focus on applying JMeter ramp-up usage best practices to mimic different load cases for our application.
Back to topWhat is the JMeter Ramp Up Period?
The JMeter Ramp-up Period is the amount of time it takes Apache JMeter™ to add all test users (threads) to a test execution, or how long it will take for JMeter to start execution of all the threads.
One of the most critical aspects of performance testing is the ability to mimic a real-life load on your application. But determining the number of concurrent users for the target load isn’t enough. Tested applications could fail in production under the same target load that was used during the test phase.
Or, an application could fail under the test load when the problem is a bottleneck in your system. These things happen because in addition to the target load, developers and performance testers should also care about how the load is distributed during test execution.
The JMeter ramp up period helps teams simulate a wide range of load scenarios for an application.
Experience how BlazeMeter helps teams do JMeter testing at enterprise scale. Try BlazeMeter for free today >>
Back to topRamping Up Your JMeter Test Scenario
We are going to test the http://blazedemo.com/ web app. We will apply various loads with the same target threads value, but with different combinations of ramp-up period. You can also test http://blazedemo.com/.
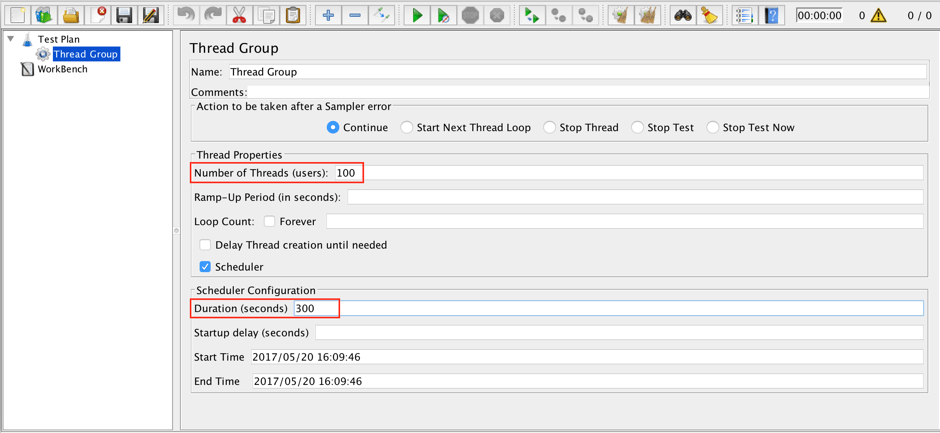
1. First of all, we need to create a thread group with the target number of threads (let’s say 100).
Right click -> Add -> Threads -> Thread Group
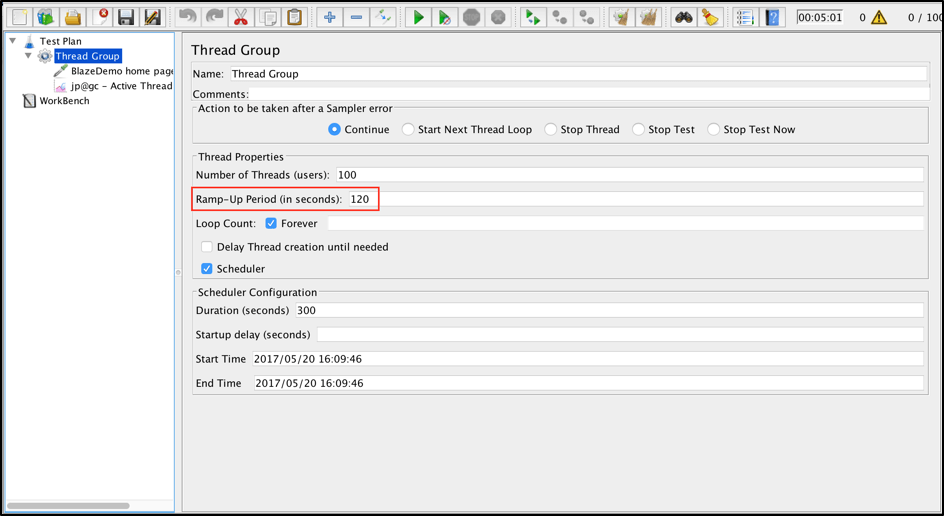
Change the value of the Number of Threads to 100. Now let’s assume that you want to run our test for 5 minutes. Therefore, you need to specify the value 300 in ‘Duration’ field. For now, let’s keep the “Ramp-Up Period” field in the thread group empty.
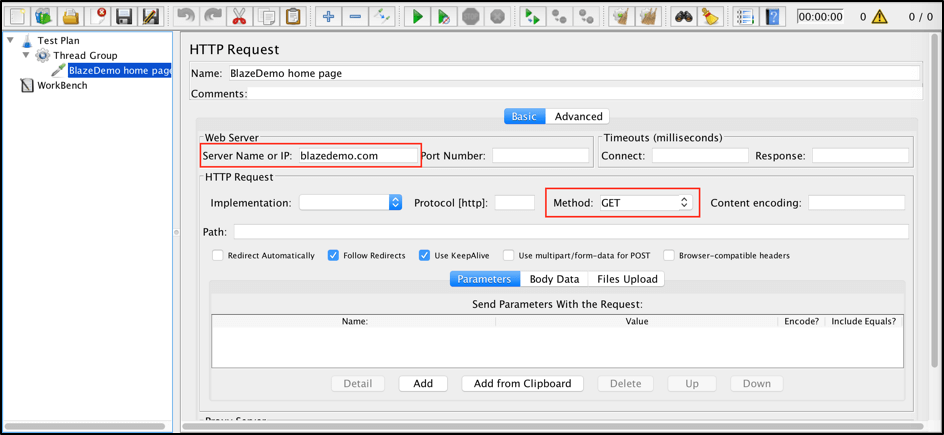
2. Add one sample that hits the homepage of tested web application. It will be a GET request to blazedemo.com based on the HTTP protocol.
Right Click on Thread Group -> Add-> Sampler -> HTTP Request
I changed its name to “BlazeDemo home page”. Add “blazedemo.com” as the server name, and make sure the method is set to GET.
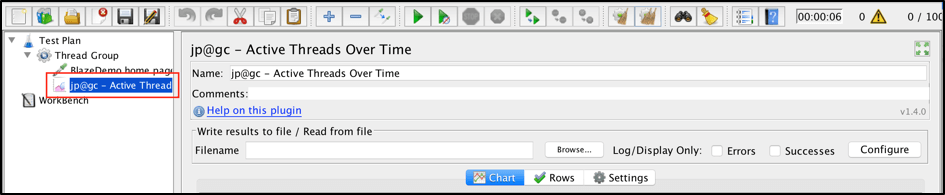
3. It’s useful to see a graph with user distribution. Such a graph helps us visualize the load pattern and check what we are going to test. JMeter doesn’t offer these options out of the box, but you can easily install the ‘Custom plugins package’, which contains many useful listeners (check out installation instructions). One of the plugins is called ‘Active Threads Over Time’ and that’s exactly what we are looking for. To add the listener just go to:
Add -> Listener -> jp@gc - Active Threads Over Time
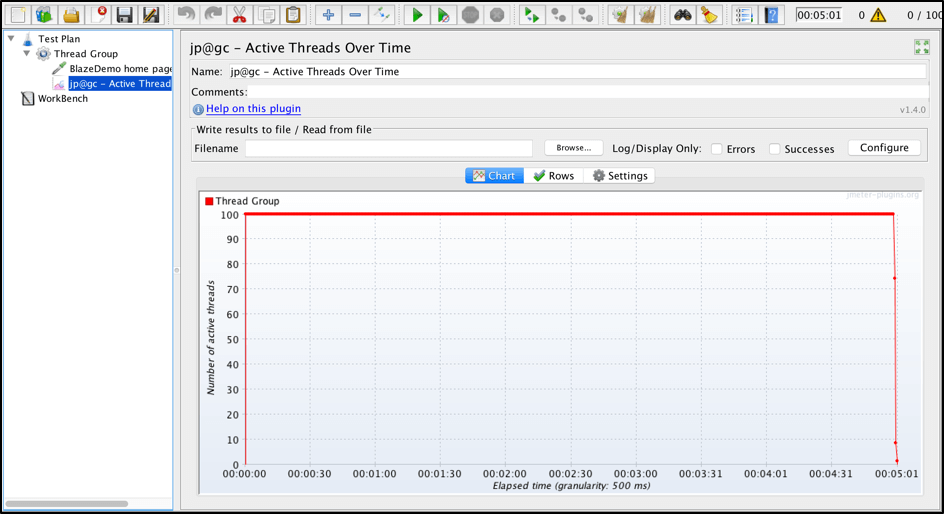
Keep in mind that the ramp-up period should not be 0 if you have large number of target threads. Ramp-up 0 means that the JMeter testing script will add all the threads at once in the beginning of the test execution, and therefore it will put very severe load on your application at once.
Of course sometimes you might want to simulate such load, for example during spike performance tests, but this is a separate case that has a separate best practice approach (and is covered below). But even with spike tests we usually don’t want all users on board in first second of test execution.
This scenario doesn’t look realistic and usually such load propagation doesn’t make any sense. If you have a web application, users will usually come to your site more or less gradually and your servers have enough time to adjust and scale appropriately.
Ramp-up distribution should be based on your needs. Therefore, the first thing that needs to be done is to understand your test targets. The best way to do so is to learn and find out your current load patterns from production. But at the same time, in many cases it’s enough to create a linear ramp-up, which shows users coming gradually to your site or app.
Back to topCreating a Linear Load Ramp-Up
4. Go back to the Thread Group and change the Ramp-Up period to 120.
Because the test duration is 300 seconds, ramping-up over 2 minutes leaves us with 3 minutes of hold time. It’s important that after the ramp-up is over and all users are up and running, there is enough hold time. Hold time confirms that the system can handle the load and that performance stay stable and don’t deteriorate.
In this test we decided on 3 minutes of hold time, but in your case all these values will be based on your specific needs and that scenario you are going to simulate.
5. Run the test and see how the number of active users gradually grows for 2 minutes.
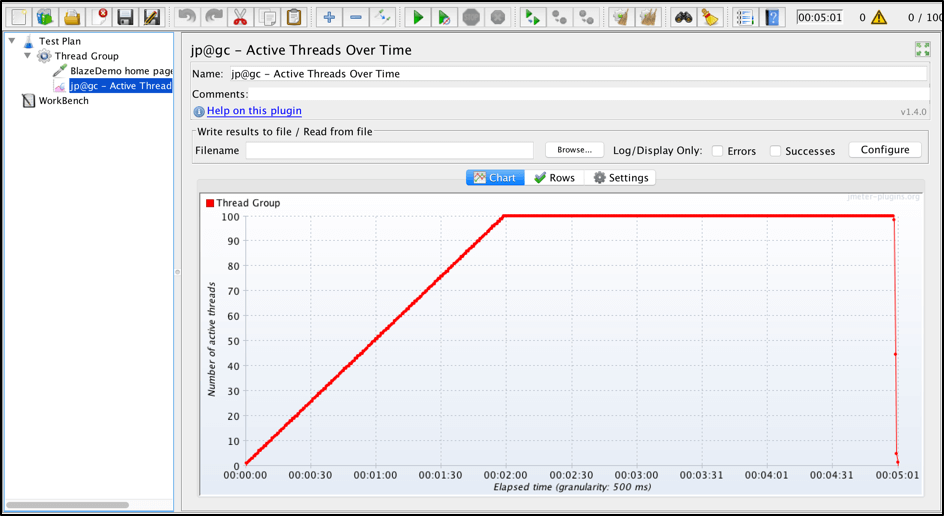
This kind of load called ‘Linear’. This approach works for many users who care mostly about the target load. However, this approach is not the best practice. Why? Because if the server doesn’t perform well under a certain load during the linear ramp-up, it will usually be hard to isolate and determine which load that was. We won’t have a clear idea which load our server can handle and which it can’t.
This is why it is much much better to perform a load by steps. so let’s divide the test duration into stages.
Back to topCreating a Stepping Load Ramp-Up
We still want to test 100 users, but we’ll ramp them up them gradually, in steps. We’ll start with 25 users holding a load for a certain period to see how the server handles it. Afterwards we will add 25 more to get to 50, them another 25 to get to 75, and a final 25 to get to 100 users. This approach works much better and is more reliable.
Unfortunately, JMeter doesn’t support load steps out of the box. But you can easily install the appropriate plugin called ‘Ultimate Thread Group’. This plugin gives you very strong control and flexibility over load distribution andis way for you to propagate a load for your application under test.
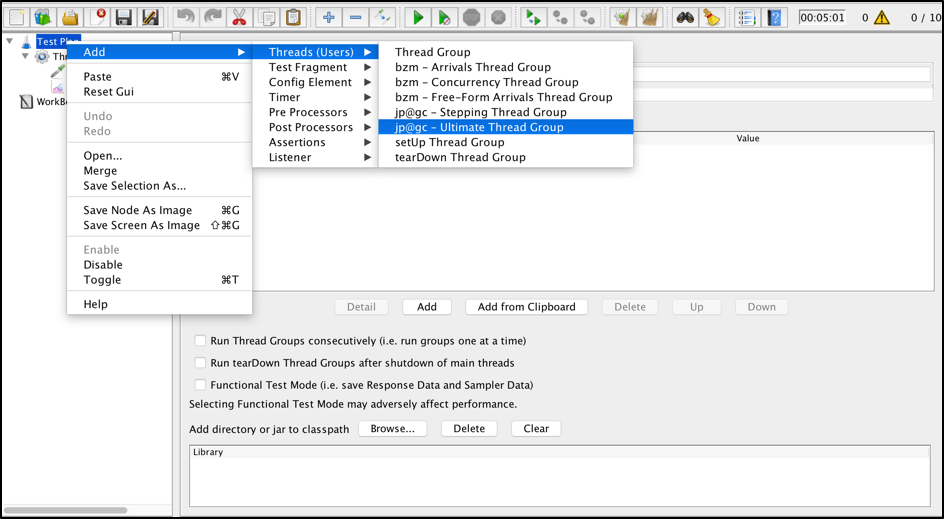
4. The ‘Ultimate Thread Group’ is similar to the default ‘Thread Group’ JMeter element and can be found by:
Right click on elements tab on the left -> Add -> Threads (Users) -> jp@gc - Ultimate Thread Group
5. After the creation of ‘Ultimate Thread Group’ element we can copy our ‘BlazeDemo home page’ request sampler and ‘Active Threads Over Time’ listener from the initial ‘Thread Group’.
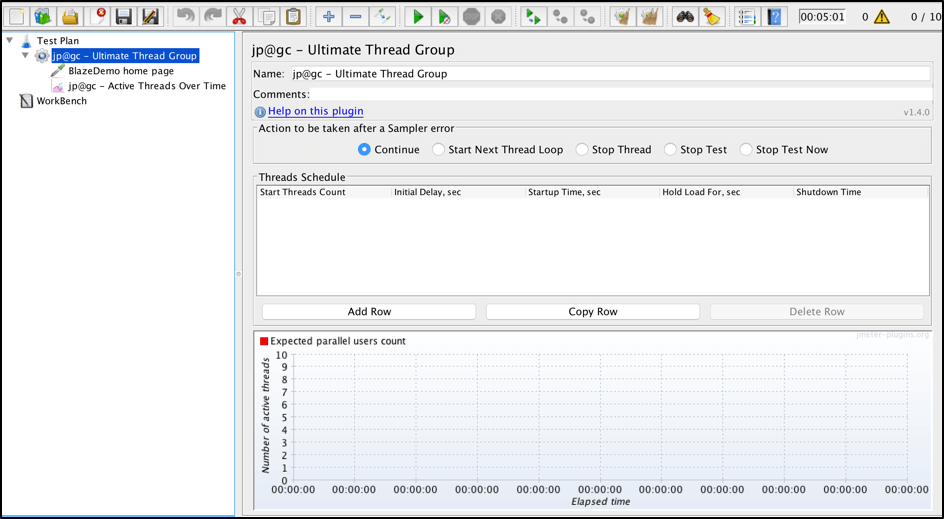
6. The Ultimate Thread Group provides a ‘Threads Schedule’ table, where you can configure different groups of threads.
You can decide on the number of threads (‘Start Threads Count’), the delay before each group will start to be added to the test execution (‘Initial Delay, sec’), the ramp-up period for group (‘Startup Time, sec’), the time to hold the group before ramp-down (‘Hold Load For, sec’) and how fast all the threads of specified group should be turned off (‘Shutdown Time’).
All thread groups start at the same time but each one has its own ‘Initial Delay’ value, which helps spin up users from each group separately.
One more great feature of ‘Ultimate Thread Group’ plugin is that you can see the expected load distribution in the graph below, and tune distribution values according to your needs, even before running the script and without tricky calculations in mind.
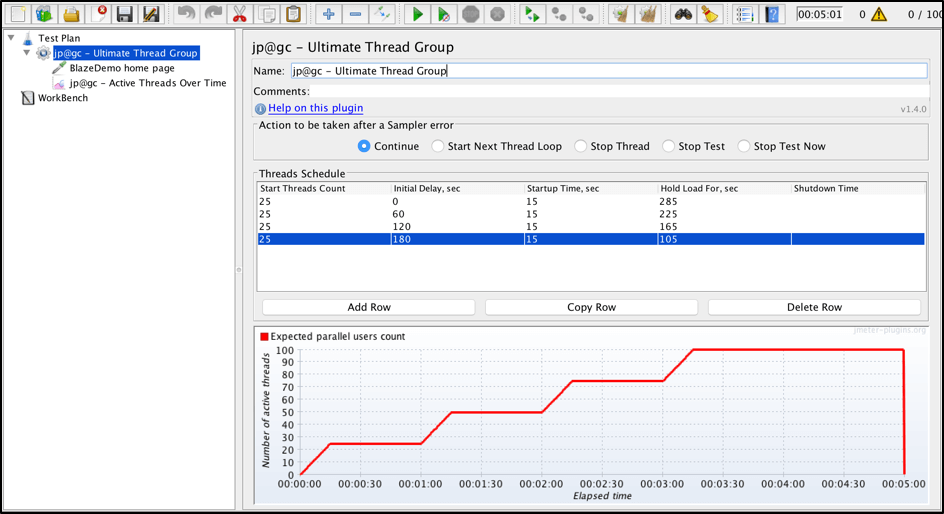
Let’s divide our test on 4 steps adding 25 users each minute. In this case our Threads Schedule will look like this.
Ramping Up Spike Testing
Another great example of case where such load flexibility might be useful is spike testing. Basically, spike test is a kind of performance test in which application is tested under unexpected increment and decrement of load to see how it behaves in this case and will it be able to handle such spike.
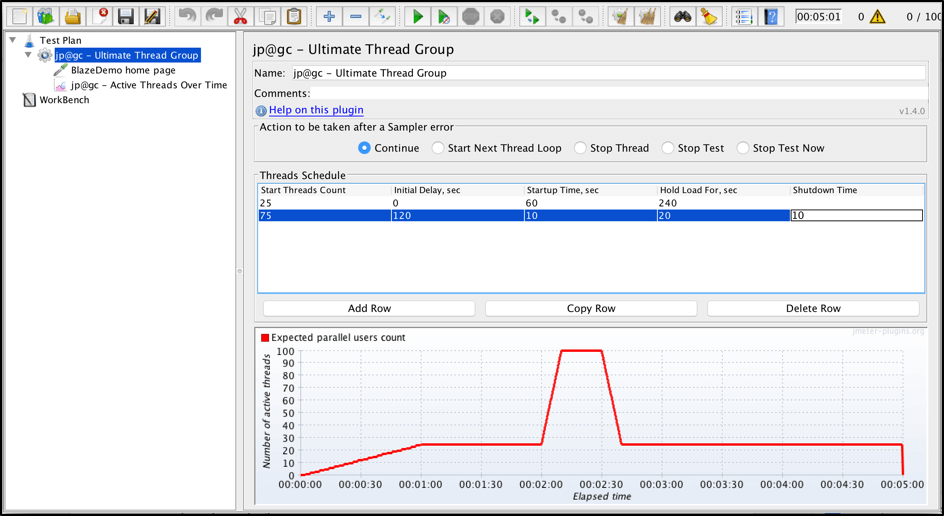
Let’s tune our ‘Threads Schedule’ to simulate some kind of spike test. To simulate that pattern we need to use ‘Shutdown Time’ column which is responsible for threads ramp-down.
BlazeMeter also provides ramp-up capabilities, as well as real-time control of thread distribution. Ramp-up and ramp-down are extremely important to mimic the real load on your application. Ramping up and down allows you easily simulate any load pattern you can ever have in production, and to prepare for all the possible cases you might have, so you never see your app go down.
To check out BlazeMeter, just put your URL or JMX file in the box below and your test will start in minutes. Or, request a demo.