Blog
January 18, 2021
How to Use the Jenkins Performance Plugin

Open Source Automation,
Performance Testing
Using a Continuous Integration system is a very convenient way to organize the process of building, testing and delivering software. Jenkins has many plugins that enhance its usability, and one of these is the Jenkins Performance Plugin. The Jenkins Performance Plugin allows users to run tests using popular open source load testing tools, get reports from them and analyze graphic charts. This ability is very important for testing the stability of applications.
In this blog post, we will review how to use Jenkins with this Performance Plugin. You will learn how to organize your software performance testing in each software build, so you can better understand if your application is stable under a load. Running performance tests in each build can help us determine if recent changes are causing problems, if there is a more gradual degradation of system performance or if your system is able to handle its traffic load optimally. This plugin is managed, maintained and evolved by BlazeMeter’s Andrey Pokhilko.
To get started you need to set up some pre-conditions:
- Install Jenkins on a machine that you have access to
- Install the Jenkins Performance Plugin on the machine with Jenkins
- Install Taurus on the Jenkins machine
- Install Apache JMeter™ on our local machine
Back to top
Creating a Performance Testing Script in JMeter
Let’s start by creating a simple JMeter script for demo purposes. I chose the BlazeDemo website (http://blazedemo.com/) to create our performance script and run tests. The BlazeDemo website is available to the public for testing and trying out performance scripts.
1. Add a Thread Group to the Test plan.
Test plan -> Add -> Thread (Users) -> Thread Group
Set the following values:
- Number of Threads: 10
- Ramp-Up: 2
- Loop Count: 10
This Thread Group will run the script 10 times for 10 concurrent users with a Ramp-up time of 2 seconds.
2. Add a HTTP Request that opens the landing page of the tested web app.
Thread Group -> Add -> Sampler -> HTTP Request
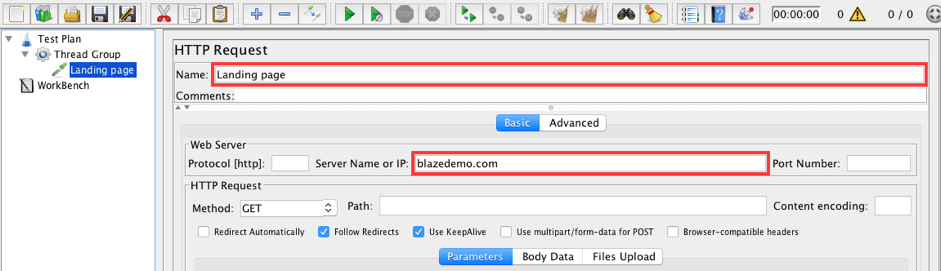
Set the following values:
- Name: Landing page
- Server name or IP: blazedemo.com
This is the first step of our demo script that just opens a landing page.
3. Add a HTTP Request that opens the login page of the tested web app.
Thread Group -> Add -> Sampler -> HTTP Request
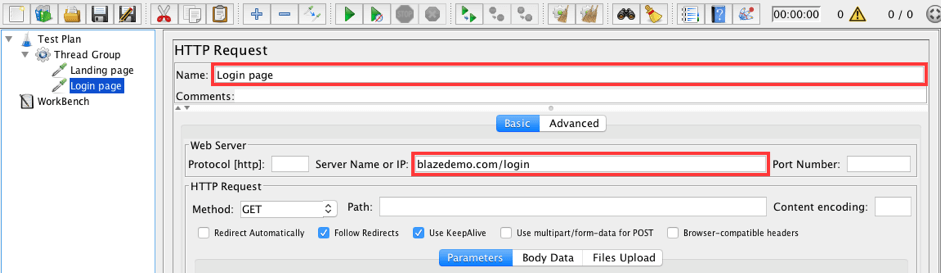
Set the following values:
- Name: Login page
- Server name or IP: blazedemo.com/login
This is the second step of our demo script that simply opens a login page.
This script is done. Store it with the name ‘blazedemo_script.jmx’.
Back to topRunning Your Test With The Jenkins Performance Plugin (Option 1)
4. Create a Freestyle project in Jenkins.
Open Jenkins URL in browser -> Login to Jenkins -> Click New Item
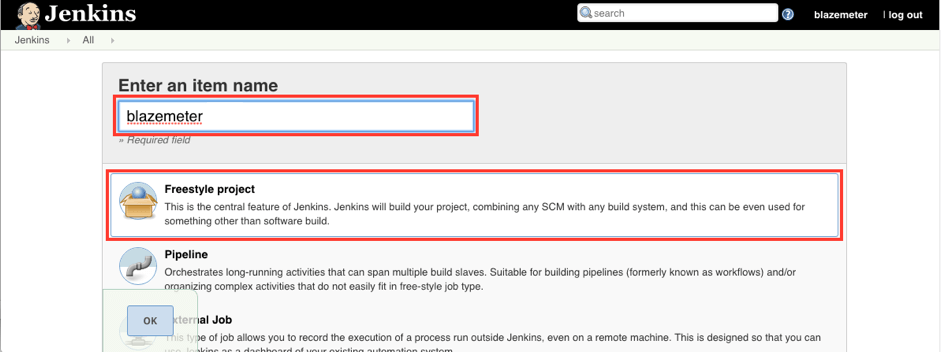
Set the name and type of the project:
- Name: blazemeter
- Type: Freestyle project
Click the OK button.
After saving the project we will see the configuration page.
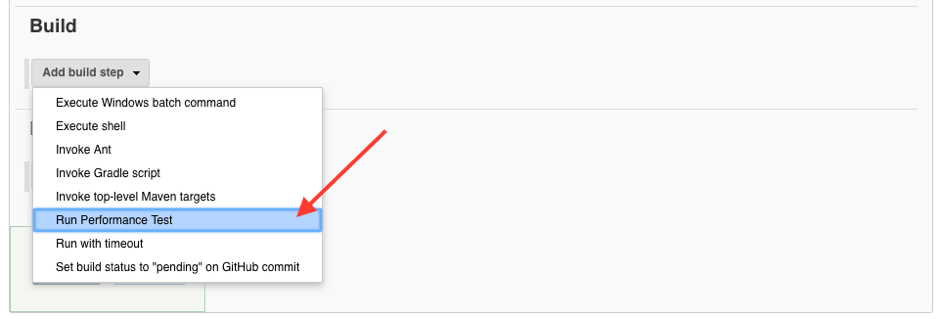
5. Set up a performance test to run the JMeter script directly.
Scroll down to the Build section -> Click Add build step -> Click Run Performance Test
The Run Performance Test section should be presented with only one field available: ‘Taurus tool parameters’. Use the Advanced button to see more.
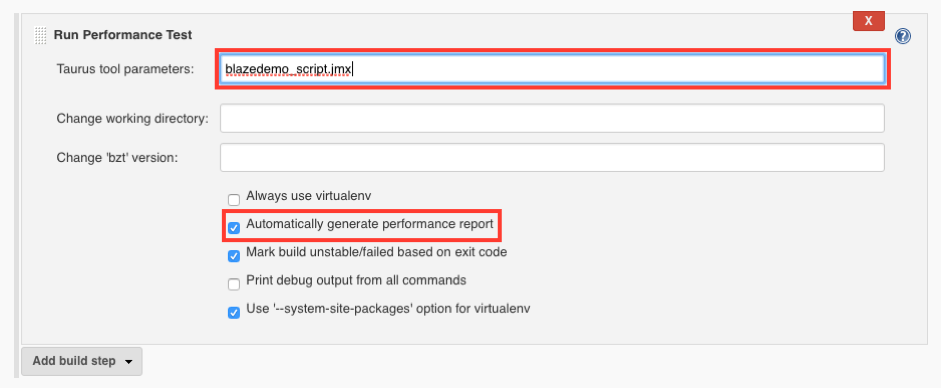
Set the following value:
- Taurus tool parameters: blazedemo_script.jmx
Let’s not change anything in the advanced options for now. Just make sure that the ‘Automatically generate performance report’ checkbox is checked.
Click the Save button.
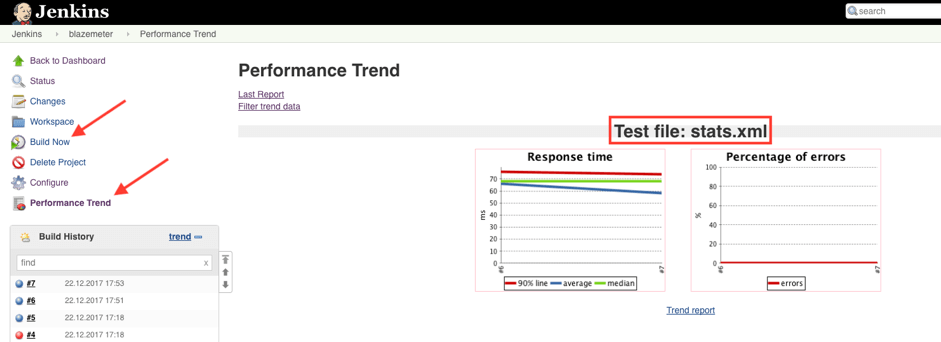
6. Find the Performance Trend menu item.
Check the side menu, you should see the Performance Trend item in it.
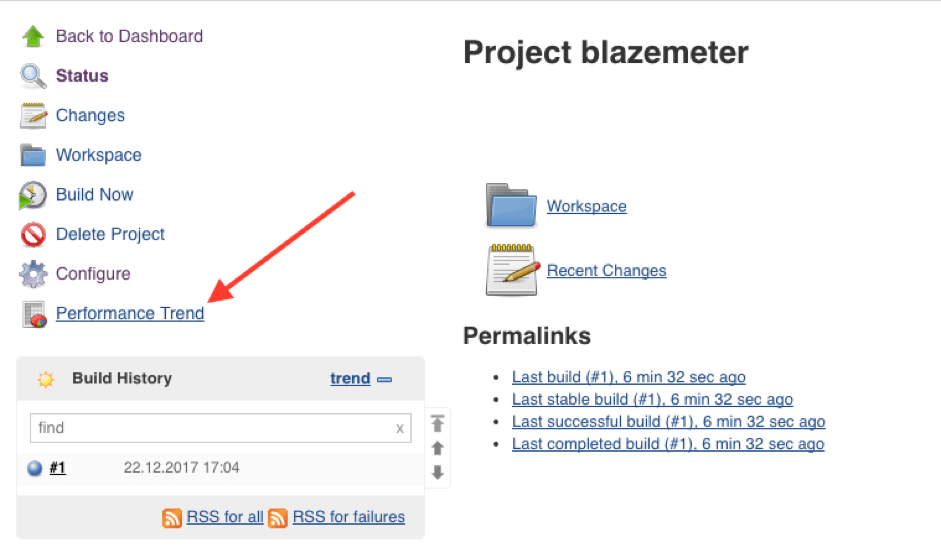
The presence of the “Performance Trend” link means that we added a Performance test run to each build.
7. Add the JMeter script to the project location on the Jenkins machine.
In my case I copied my script to the following location:
~/.jenkins/workspace/blazemeter
NOTE: The project folder appears only after the first run of the project build.
Great! We are ready! Now a performance test will run after each application build.
Back to topAnalyzing Performance KPIs on Jenkins
8. Build the project a couple of times and check the graphs on the right side of the Status screen.
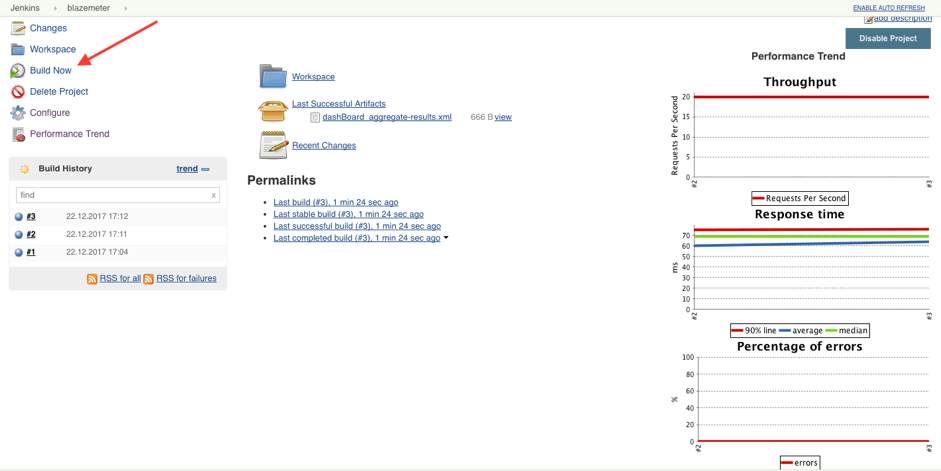
We can see three graphs on the right side of the page: Throughput, Response time and Percentage of errors.
9. Review the Performance Trend page
Click the Performance Trend menu item
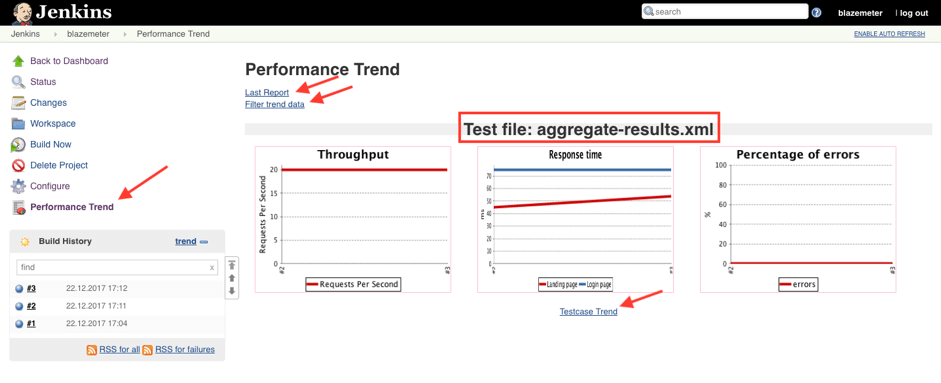
This page contains the same three graphs as the Status page and three links to other pages: Last report, Filter trend data and Testcase Trend.
Let’s review the internal pages.
10. Last Report page
The "Last report" means the performance report for the latest load test build according to the date and time.
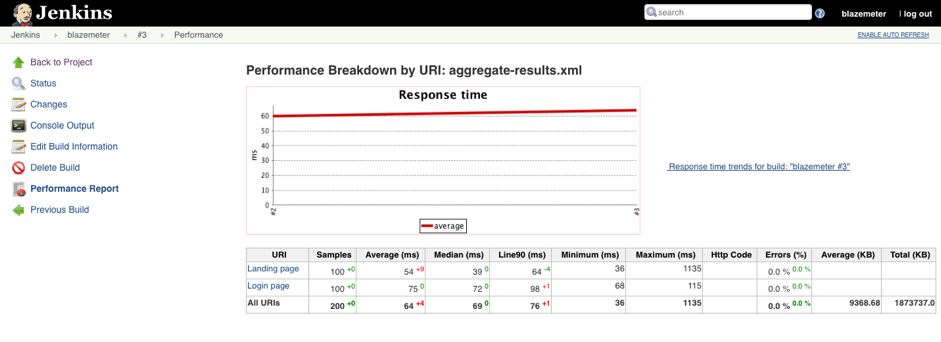
The last report page contains a graph of the response time and detailed information for each step of the script. The table under the graph contains columns: URI, Samples, Average (ms), Median (ms), Line90 (ms), Minimum (ms), Maximum (ms), HTTP Code, Errors (%), Average (KB), Total (KB).
11. Filter trend data page
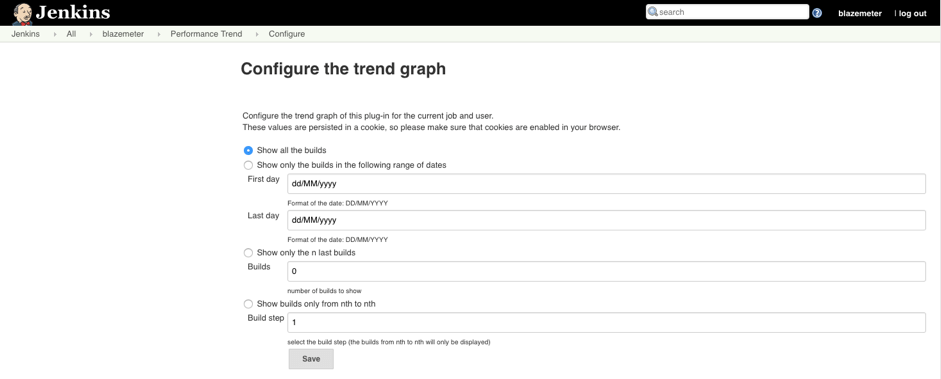
Here we can configure the trend graph with some options: show only the builds in a certain range of dates; show only the last n builds; show only from nth to nth.
Nth to nth means jumping by counts of n. For example, if the user sets n = 5, the performance graphs will show the 5th, 10th, 15th, 20th ... builds. If the user sets n = 10, the performance graphs will show only the 10th, 20th, 30th ... builds.
12. Testcase Trend page
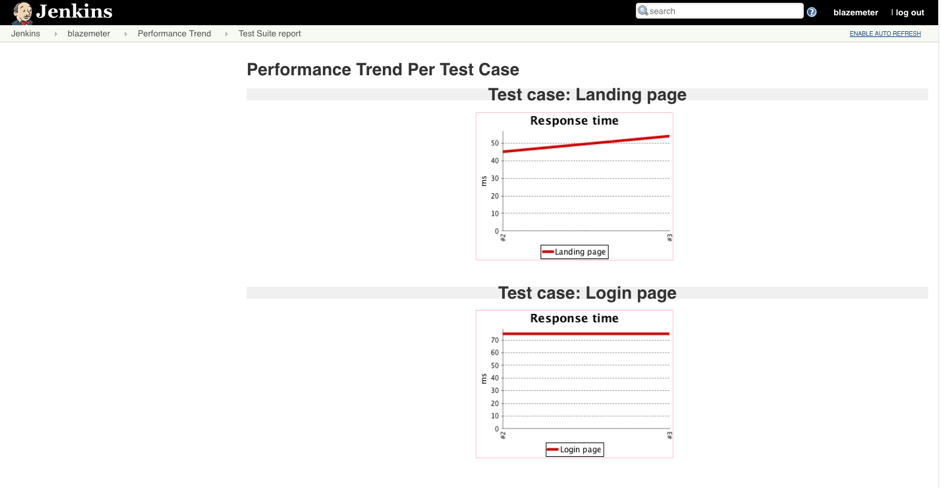
This page contains separate response time graphs for each step of the ‘blazedemo_script.jmx’ script.
We considered one way to run a performance test. Let’s take a look at another approach by using Taurus.
Back to topRunning Your Performance Test on Jenkins with Taurus (Option 2)
You can also use Taurus to run your performance test on Jenkins. The advantages are that you can change parameters like the number of concurrent users, the number of iterations and so on, without having to change the script itself. Instead, all of these configurations can be done within the config file.
The following steps replace the steps we performed in Jenkins.
4. Set up the Taurus config file.
Create the file ‘blazedemo_config.yml’ in the project folder on the Jenkins machine with the content:
execution:
- iterations: 10
  concurrency: 10
  ramp-up: 2s
  scenario:
    script: blazedemo_script.jmx
reporting:
- module: final-stats
  dump-xml: stats.xml
This config file means that the ‘blazedemo_script.jmx’ script will be run for 10 concurrent users, 10 times, with a ramp-up time of 2 seconds. The report will be saved to ‘stats.xml’.
Open Configure page -> Scroll down to Build section
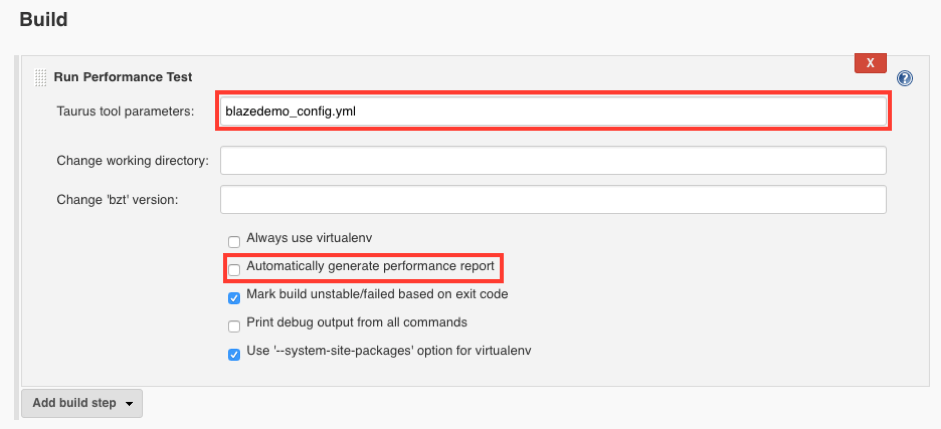
Update the build params:
- Taurus tool parameters: blazedemo_config.yml
- Automatically generate performance report: false
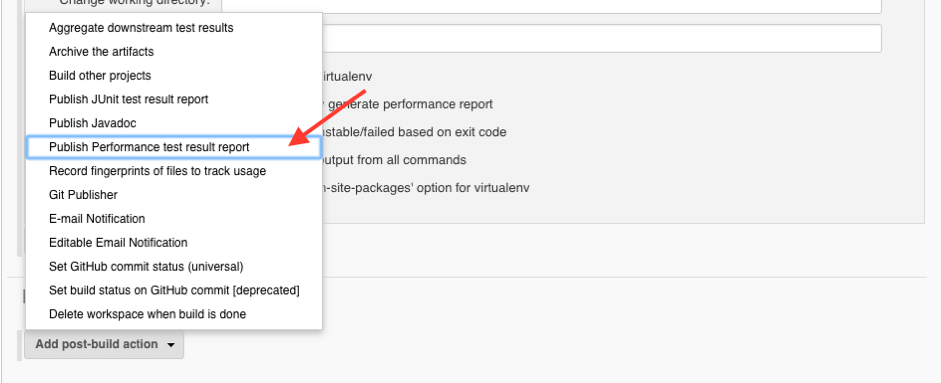
5. Set up the Performance test result report.
Scroll down to Post-build Actions section -> Click Add post-build action -> Click Publish Performance test result report
The Publish Performance test result report section should appear. It contains a number of options and fields to configure the report. Let’s see how it works in action.
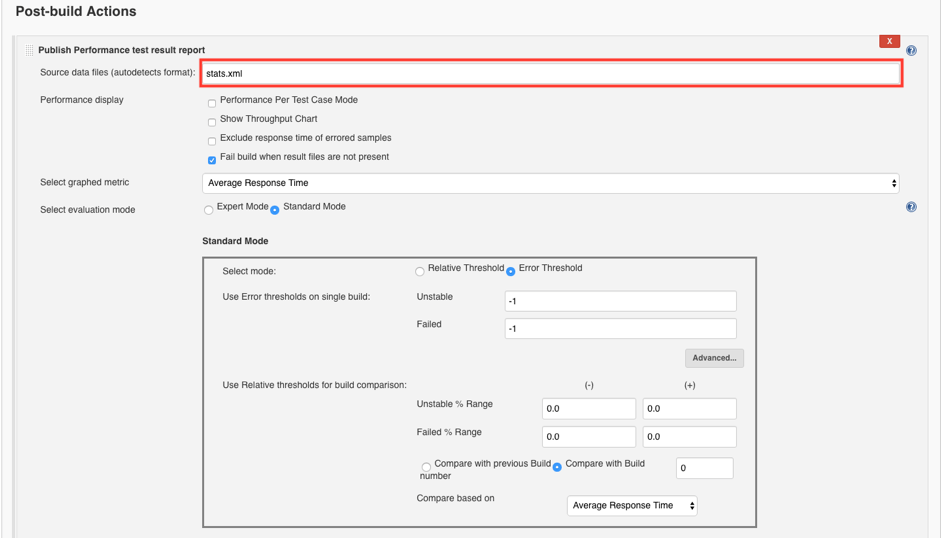
Set the following value:
- Source data files (autodetects format): stats.xml
Click the Save button.
Those changes are enough to give us the default report for our performance test.
6. Review the new Performance Trend page.
As in the previous steps build the project a couple of times and go to the Performance Trend link.
As we can see statistics are taken from the stats.xml file and have only two graphs by default: Response time and Percentage of errors.
The page also contains tree links: Last Report, Filter trend data and Trend report. The first two work similar to steps 10 and 11, while the Trend report is new.
7. Trend report page
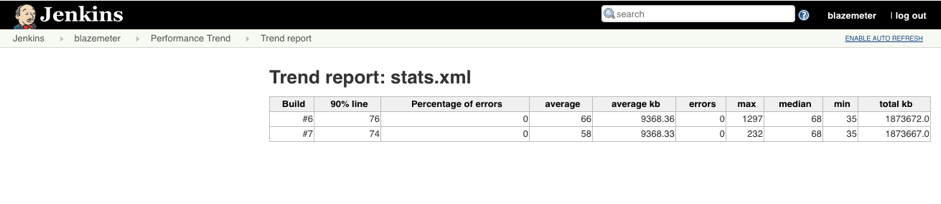
This page contains a table with detailed information about each performance test we have run. The table consists of the following columns: build, 90% line, percentage of errors, average, average kb, errors, max, median, min, total kb.
Cool. Now we know how to configure performance testing using Taurus. But it is also very useful to know if our application is stable enough under load. To check out how to do that, let’s configure Jenkins to change the build status based on the percentage of failed requests.
Back to topSetting Error Thresholds With The Jenkins Performance Plugin
Set up the Error Threshold.
Open Configure screen -> Scroll down to Post-build Actions section
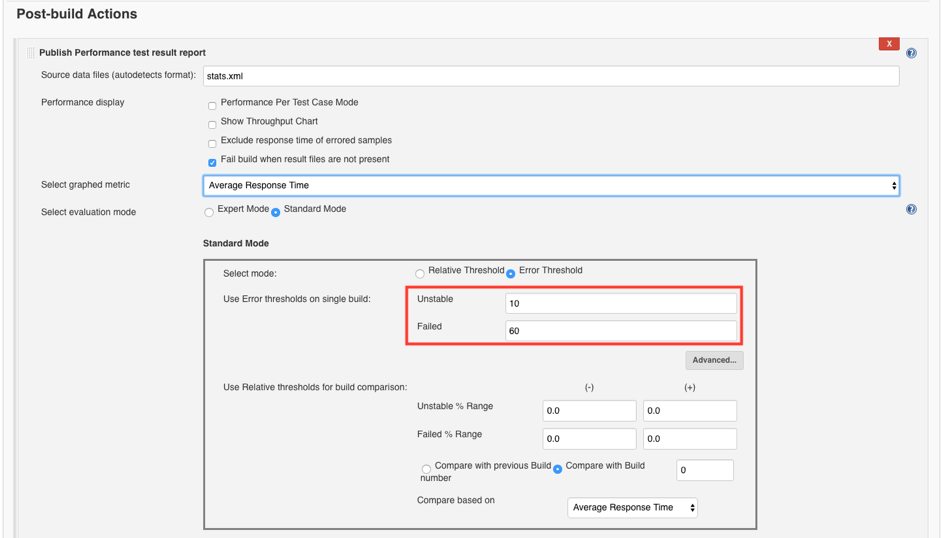
Set the following values:
- Unstable: 10
- Failed: 60
This configuration will mark the build as unstable when errors are at 10% and as failed when 60% of our requests failed.
OK. Let’s “fix” our script to fail half of the requests for demo purposes.
Add a Response Assertion to the Login page sampler in the JMeter script. Configure this assertion with a false assertion so it fails the login page request. We need it for demo purposes.
Login page -> Add -> Assertions -> Response Assertion
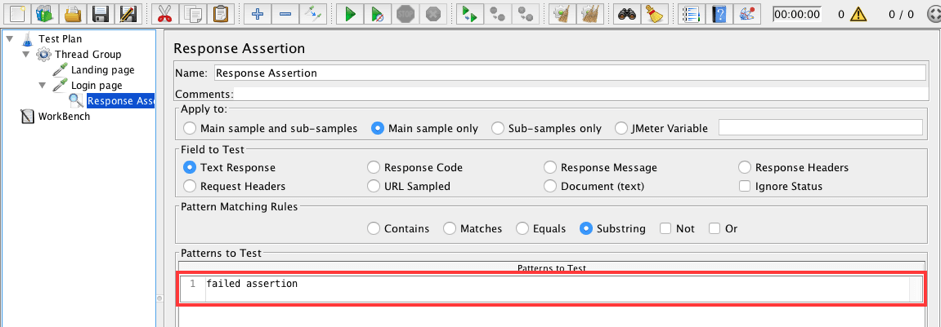
Add a row to the Patterns to Test field: failed assertion
Replace the old script with the updated one in the project folder on the Jenkins machine.
Build the project one more time.
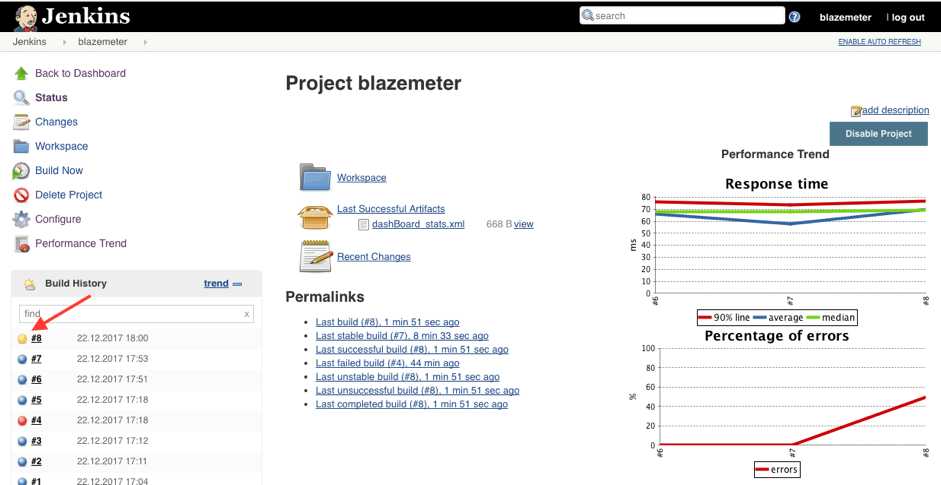
The build is marked as unstable (yellow color) since 50% of the requests failed, which is between 10% and 60%.
Change the Error Threshold.
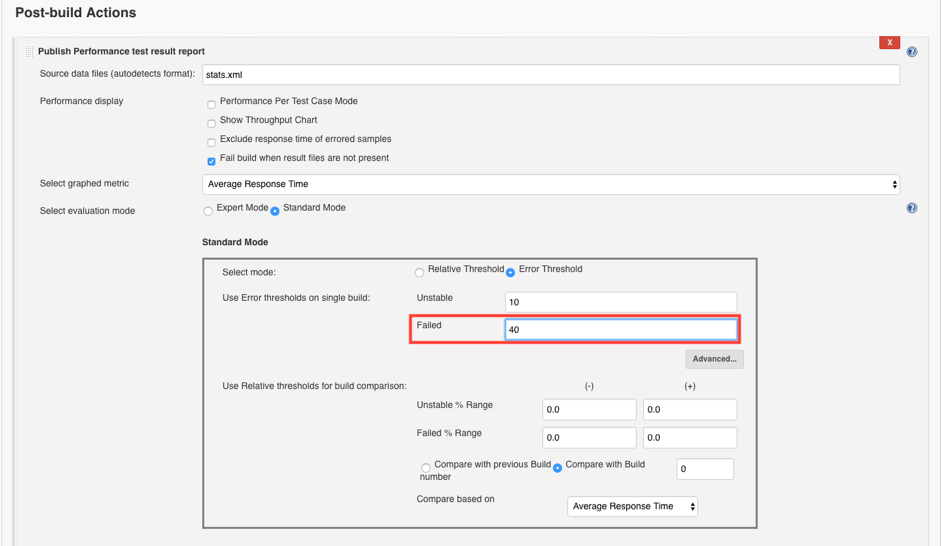
Set the following values:
- Unstable: 10
- Failed: 40
This configuration will mark the build as unstable when errors are at 10% and as failed when more than 40% of the requests failed.
Build the project and check the results.
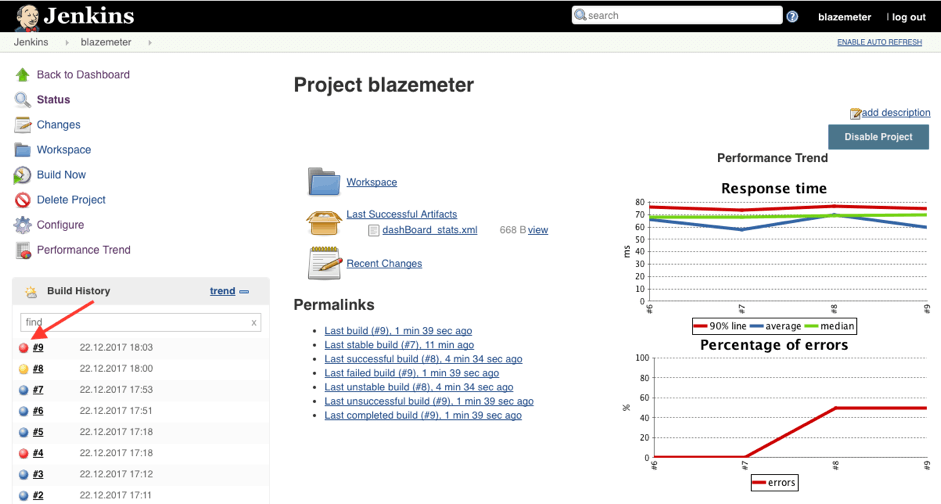
The build is marked as failed (red color) since 50% of the requests failed and this is above the 40% threshold.
Back to topBottom Line
In this blog post we considered: how to run a performance test after each build either by using the JMeter Performance Plugin or by using a JMeter script and Taurus, how performance reports work, and how to mark a build as unstable or failed based on the level of failed requests.
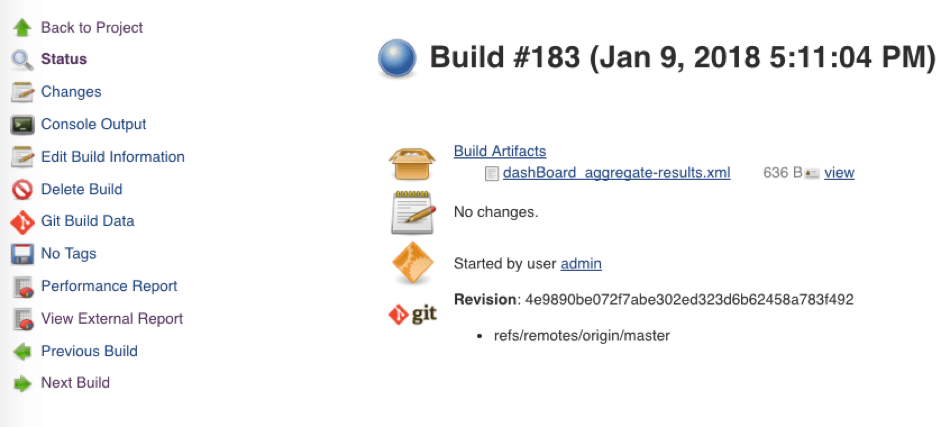
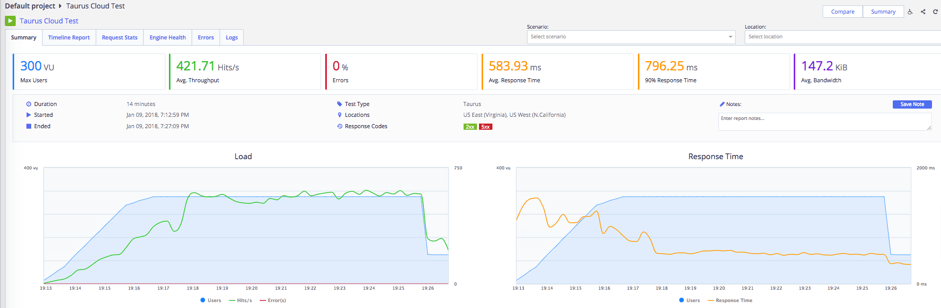
For successful requests, you can also open your Jenkins reports in BlazeMeter by clicking on “View External Report”, and get scalable tests from multiple geo-locations and more in-depth analysis.