Blog
February 18, 2019

In this blog post we are going to take a look at the JMeterPluginsCMD Command Line Tool. This command-line utility can generate PNG and CSV files based on JTL files. Thus, providing a convenient and quick way to extract the necessary data from JTL files in a presentable view, enabling easier analysis of Apache JMeter™ test results.
This tool is very similar to the right-click context menu (Save Image as and Export to CSV options) on all graphs, and it’s a better choice when you need to process a lot of JTL files or to generate a lot of PNG and CSV files based on one JTL file; it saves time.
Table of Contents:
Back to topWhat is JMeterPluginsCMD?
JMeterPluginsCMD is a Command Line Tool that lets you generate PNG and CSV files on graphs. It saves time when generating lots of files based on one JTL file.
There are two ways to install the JMeterPluginsCMS Command Line tool. The first method is to simply install it through the JMeter Plugins Manager. The second method is to download the archive from the official page and manually add the files to the corresponding folders of your JMeter. Don’t forget to restart the application.
After the installation, we should see the JMeterPluginsCMD.sh and JMeterPluginsCMD.bat files in the /bin directory of JMeter. Note: all commands below were run from the /bin folder on a MAC machine.
So let’s learn more about this tool!
Back to topTheJMeterPluginsCMD Command
First, create a JTL file in your regular JMeter script. Then, run the JMeterPluginsCMD command.
Command template:
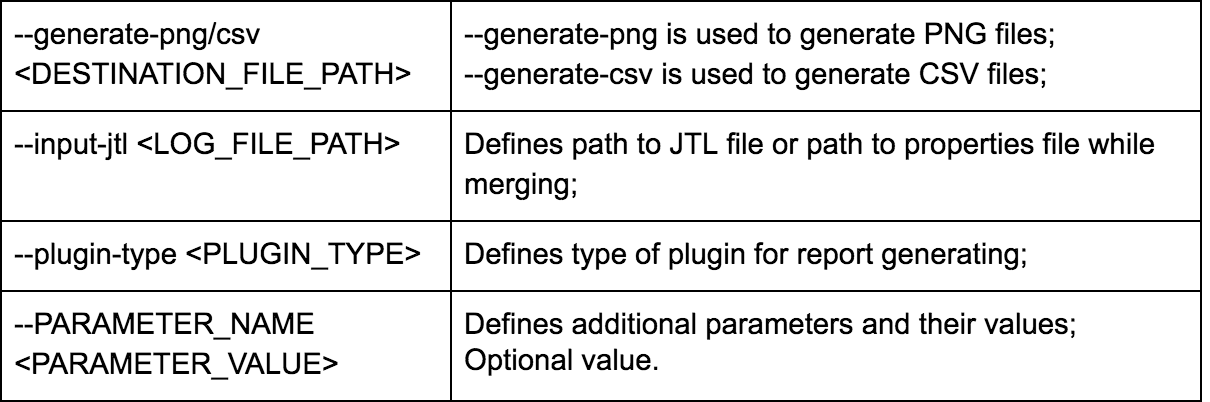
sh JMeterPluginsCMD.sh --generate-png/csv --input-jtl --plugin-type --PARAMETER_NAME
The command has 4 possible parameters:
Generating a JTL
Let’s create a basic script to generate a JTL file that we will use for demonstrating the JMeterPluginsCMD command line tool. I have chosen the BlazeDemo website (http://blazedemo.com/) to create our performance script.
The BlazeDemo website is available to the public for testing and playing with performance scripts.
1. Add a Thread Group to the Test plan
Test plan -> Add -> Thread (Users) -> jp@gc - Ultimate Thread Group
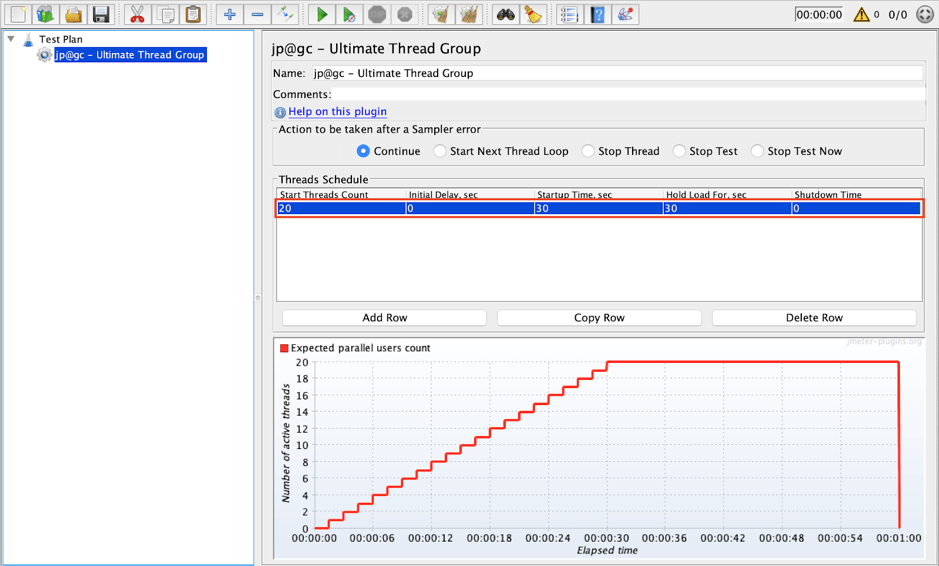
2. Add a row with the following values:
Start Threads Count: 20
Initial Delay, sec: 0
Startup Time, sec: 30
Hold Load For, sec: 30
Shutdown Time: 0
This Ultimate Thread Group will start 20 virtual users within 30 seconds and will hold its target load for 30 seconds.
3. Add an HTTP Request which opens the landing page of the test website
Ultimate Thread Group -> Add -> Sampler -> HTTP Request
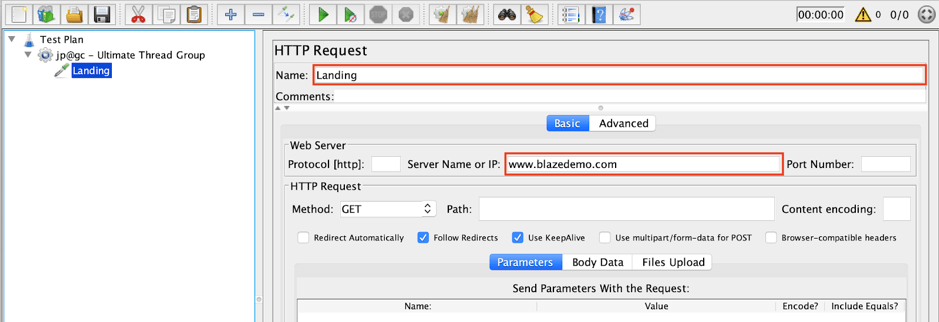
Fill in the following values:
Name: Landing
Server name or IP: www.blazedemo.com
4. Add a Constant Timer to the Landing request.
Landing -> Add -> Timer -> Constant Timer
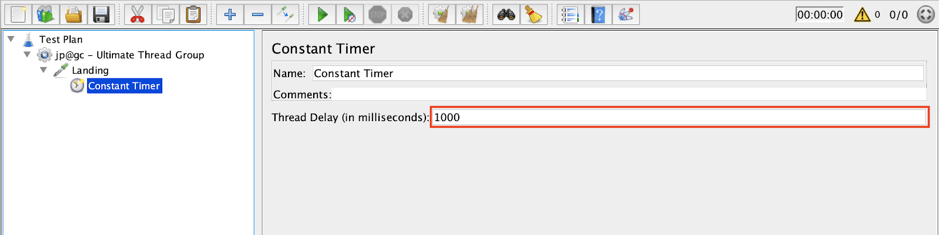
Set the following delay:
Thread Delay (in milliseconds): 1000
This timer will add a one-second delay before the Landing request.
5. Add another HTTP Request that opens the vacation page
Ultimate Thread Group -> Add -> Sampler -> HTTP Request
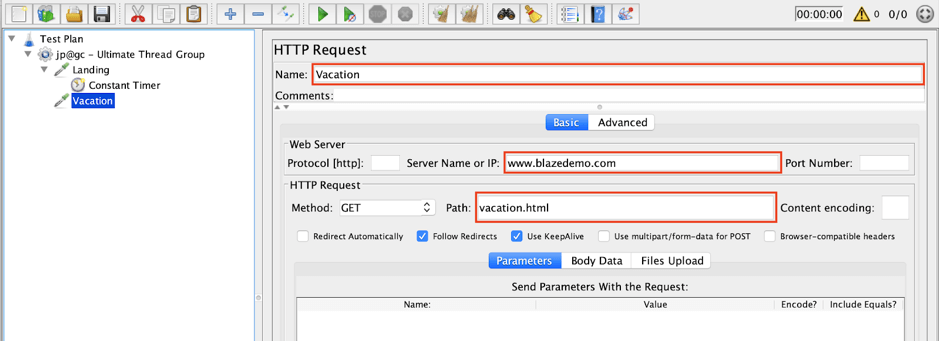
Fill in the following values:
Name: Vacation
Server name or IP: www.blazedemo.com
Path: vacation.html
6. Add a Constant Timer to the Vacation request as well
Vacation -> Add -> Timer -> Constant Timer
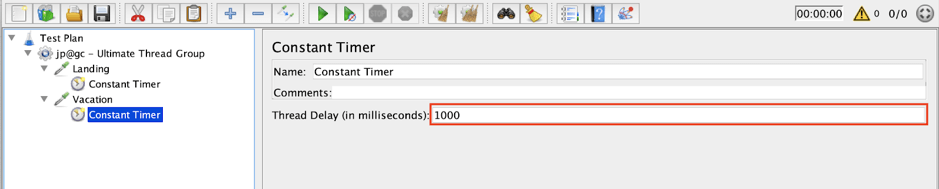
Set the following delay:
Thread Delay (in milliseconds): 1000
This timer will add a 1 second delay before the Vacation request.
7. Add a View Results Tree listener to the Ultimate Thread Group.
Ultimate Thread Group -> Add -> Listener -> View Results Tree
8. Add a Response Times Over Time listener to the Ultimate Thread Group.
Ultimate Thread Group -> Add -> Listener -> jp@gc - Response Times Over Time
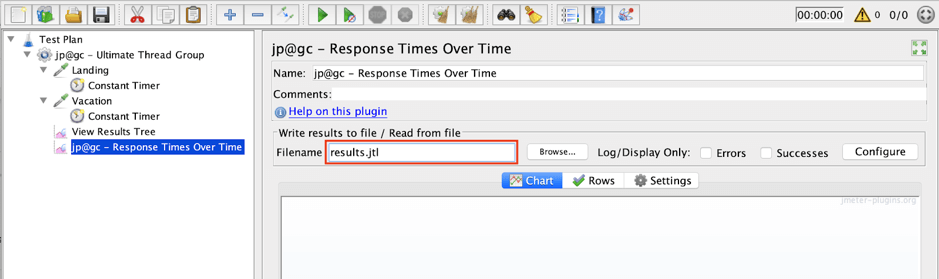
Set the following name for log file:
Filename: results.jtl
This listener will save the results of the load test to the results.jtl file.
That’s it! Our basic script is ready and we can now execute it.
9. Run the script.
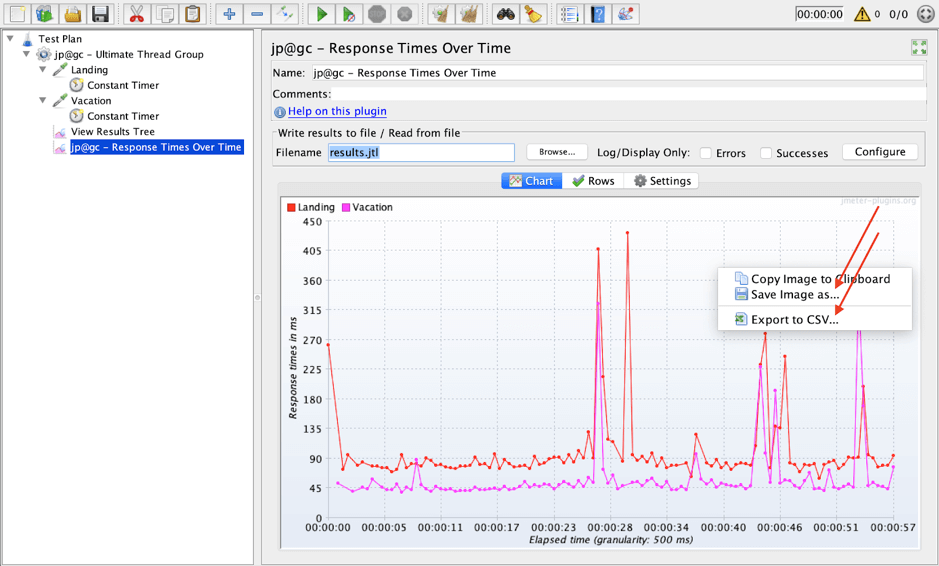
Our test passed. The test results were saved to the results.jtl file. The listener shows a graph of the response time in ms over time.
Let’s look at what we would do without the tool;
Open the context menu by right-clicking anywhere on the graph. Here we can see three options: Copy Image to Clipboard, Save Image as..., and Export to CSV. Let’s take a look at how the Save Image as... and Export to CSV options work.
10. Save the report as an image to your computer
Right-click on the graph -> Save image as ...
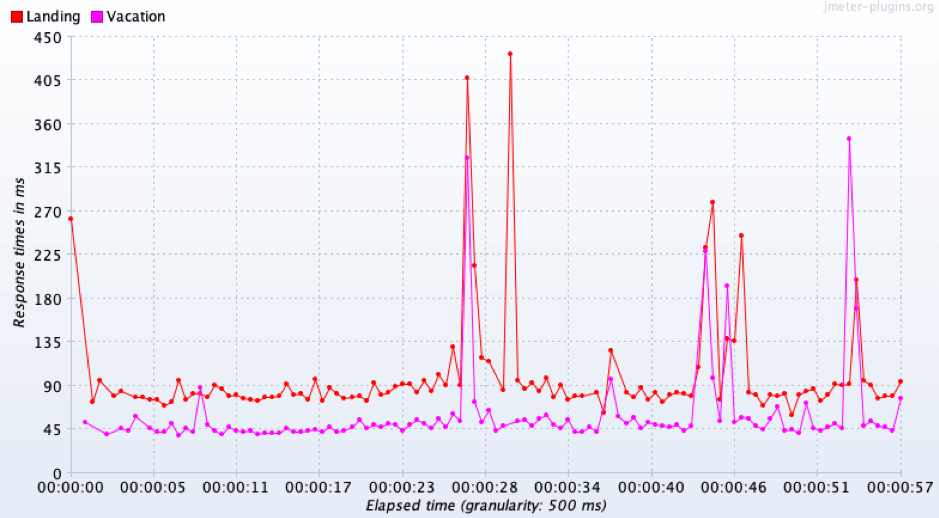
The resulting image contains a Response time over time graph and the size of the image is equal to the size of the graph area in our JMeter.
11. Save the report as a CSV file
Right-click on the graph -> Export to CSV…
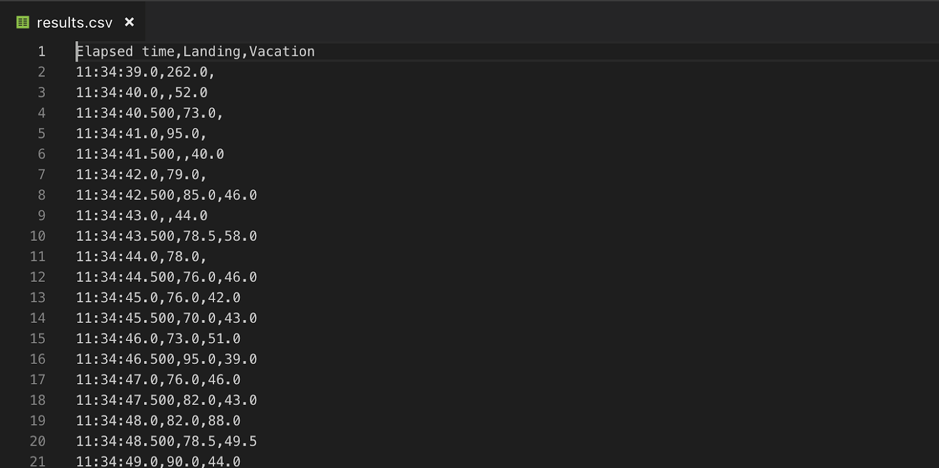
The resulting CSV file contains three columns: Elapsed Time, Landing, and Vacation.
Now that we have learned how to generate an image and csv file by using the context menu let’s take a look at how to do this using the JMeterPluginsCMD command line tool.
As mentioned above there are 2 types of files that can be generated using this plugin: PNG and CSV files. You can generate the by using the commands below.
First, make sure you copy the results.jtl file to the /bin folder of JMeter.
Then, open the command line and go to the /bin folder of JMeter.
PNG generation:
sh JMeterPluginsCMD.sh --generate-png blazemeter.png --input-jtl results.jtl --plugin-type ResponseTimesOverTime
Resulting image:
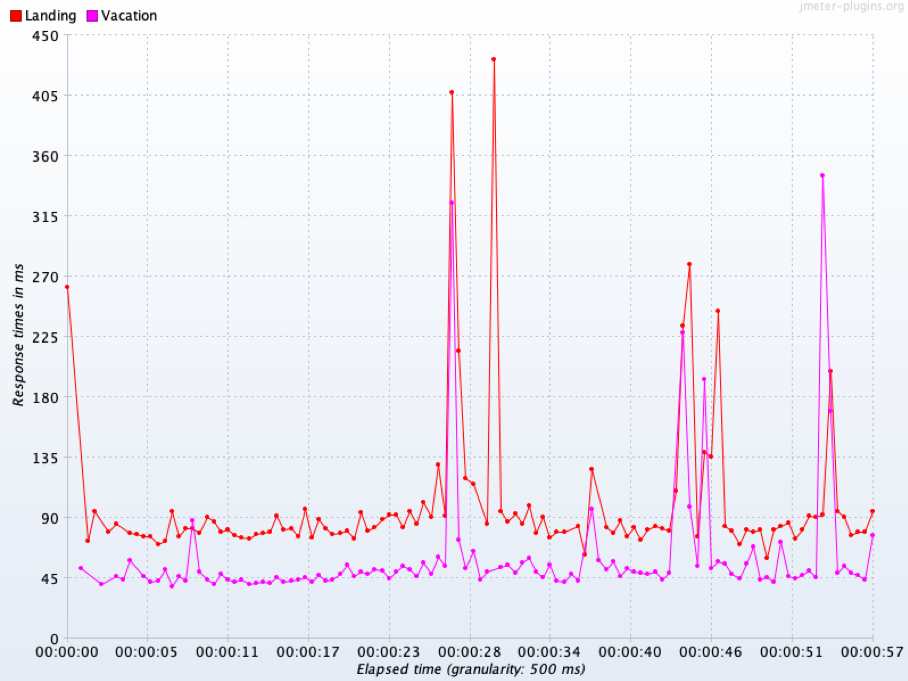
The final PNG image contains the corresponding graph. This image is similar to the image in paragraph 2.9 but with one difference: the size of the image is 800 x 600 px.
CSV generation:
sh JMeterPluginsCMD.sh --generate-csv blazemeter.csv --input-jtl results.jtl --plugin-type ResponseTimesOverTime
Resulting file:
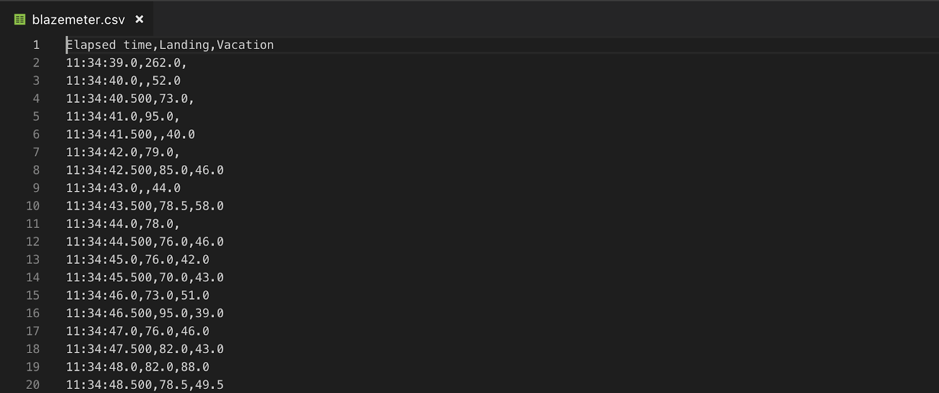
The final CSV file contains the corresponding data from the test run.
Back to topBottom Line
In this blog, we have successfully explored the basic usage of the JMeterPluginsCMD tool.
For more advanced reporting, upload your JMX file to BlazeMeter, and view your results in insightful and colorful graphs with many types of KPIs.