If you are using Maven and you need to load test your projects, you can use the JMeter Maven plugin.
Table of Contents
What Is the Maven JMeter Plugin?
The JMeter Plugin for Maven allows you to run tests from within the Maven project — instead of running performance tests as scripts in JMeter.
This blog post will go over how to run your JMeter test from Maven, and how to view the results.
Back to topHow to Use the JMeter Maven Plugin
Phase 1 - Creating a Project in Maven
Assuming you already have Maven, let’s create a simple project.
1. Open the command line and type:
mvn archetype:generate -DgroupId=com.example
-DartifactId=jmeter-testproject -DarchetypeArtifactId=maven
-archetype-quickstart -DinteractiveMode=false
This command allows us to create a basic java project which contains an example App class and a JUnit AppTest test class.
Maven will now generate a project with a standard directory structure.
Jmeter-testproject
                            |-- pom.xml
                            `-- src
                                |-- main
                                |   `-- java
                                |       `--ru
                                |           `-- apache_maven
                                |                   `-- App.java
                                `-- test
                                    `-- java
                                        `-- ru
                                            `-- apache_maven
                                                    `-- AppTest.java
pom.xml is our Maven project main file, which contains all the necessary information and dependencies binded to our project.
2. To compile a project you should go to your project directory command line and type
mvn compile
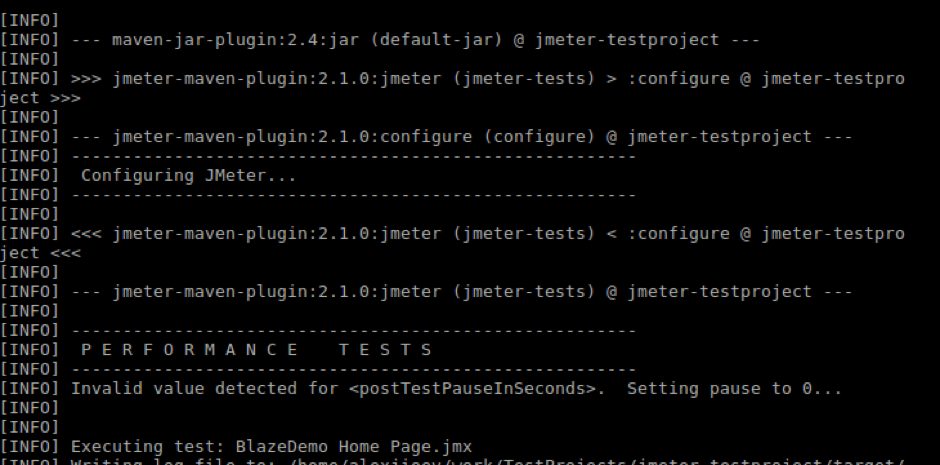
If you see an output like this...
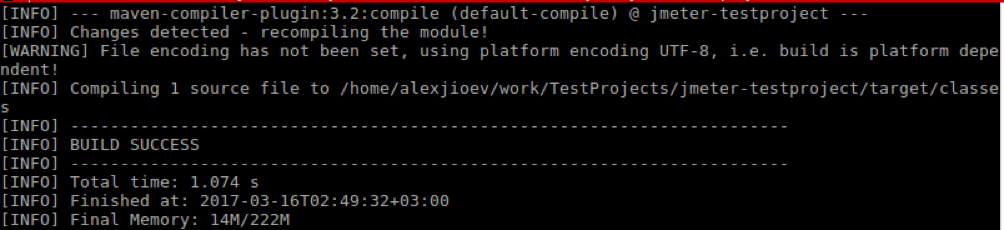
...then success! Your Maven project is created. Let’s move on to JMeter.
Phase 2 - Creating a JMeter Test
Let’s create a simple test that will simulate http-requests from 10 users to the BlazeDemo home page.
1. Open JMeter
2. Create a Thread Group
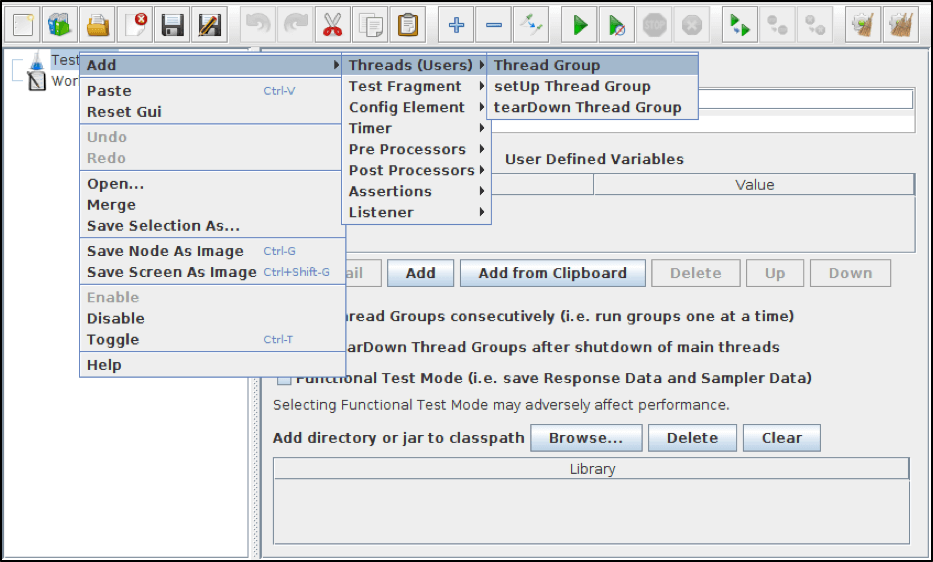
3. Let’s name the Thread Group “BlazeDemo Home page” and set 10 threads, as shown in the picture below.
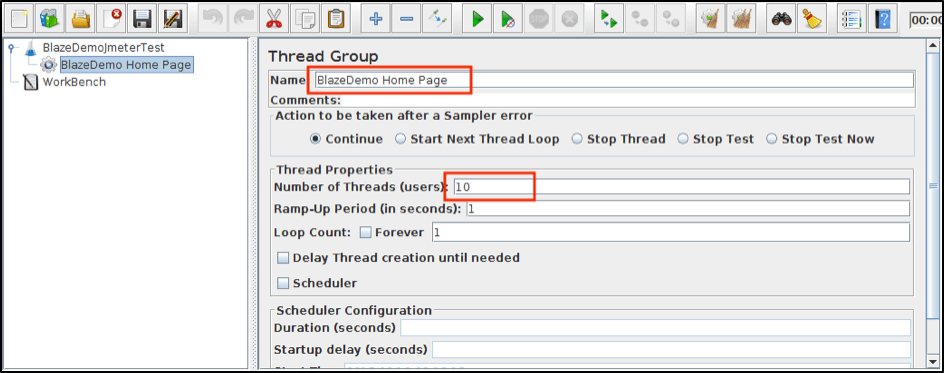
Now you need to create the actual test script, i.e. a set of various actions to create a load on the site. You can create a script manually. This is very simple.
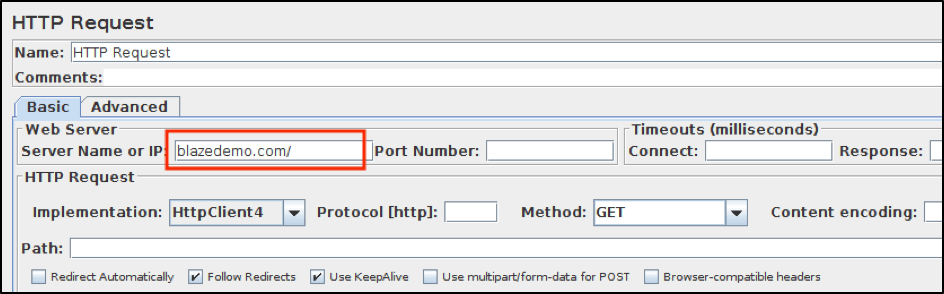
4. Add a HTTP Request element: Thread Group -> Add -> Sampler -> HTTP Request. You will receive the settings window shown in the figure below:
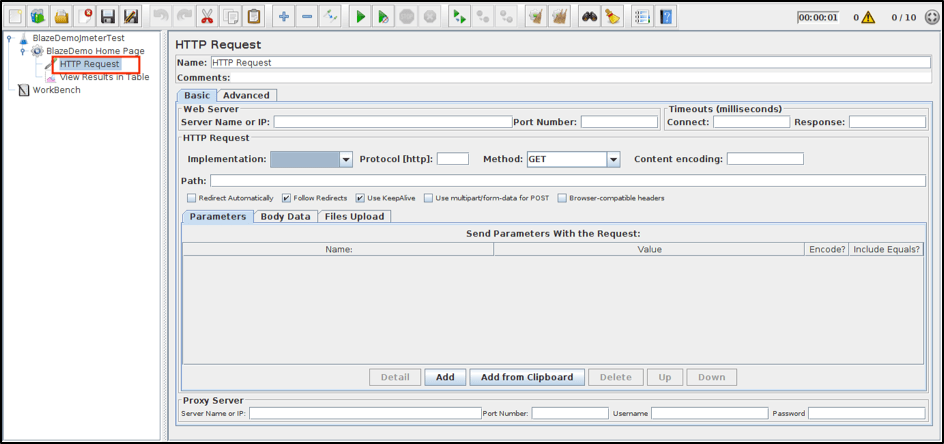
5. In the appropriate fields enter the site address, port (if necessary) and the page path:
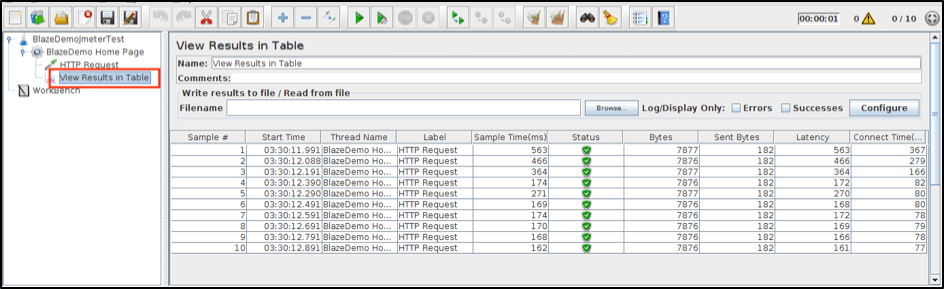
6. For your comfort, let’s create a table where you can see your requests’ statuses. Thread Group -> Add -> Listener -> View Results in Table.
7. Run your test. You will see the following result:
That’s it! You’ve created a simple test with JMeter. Now let’s run this test from Maven.
Phase 3 - Running a JMeter Test with the JMeter Maven Plugin
Now let’s take the JMeter script and see how you can run it from Maven as part of the build. The JMeter Maven plugin allows you to do just that.
1. First of all you need to add your plugin to the project. We already have the jmeter-testproject Maven project. So go to Maven project directory (jmeter-testproject in this case) and edit the pom.xml file.
Here you must add the plugin. You can find the basic configuration from GitHub. You just need to copy the configuration text and paste it in your pom.xml file.
Finally, you have a pom.xml file that looks like this:
 xmlns="http://maven.apache.org/POM/4.0.0"
xmlns:xsi="http://www.w3.org/2001/XMLSchema-instance"
  xsi:schemaLocation="http://maven.apache.org/POM/4.0.0
http://maven.apache.org/maven-v4_0_0.xsd">
  4.0.0
  com.example
  jmeter-testproject
  jar
  1.0-SNAPSHOT
  jmeter-testproject
  http://maven.apache.org


      junit
      junit
      3.8.1
      test


            com.lazerycode.jmeter
            jmeter-maven-plugin
            2.1.0


                    jmeter-tests

                        jmeter
2. Create a src/test/jmeter directory, and place your JMeter load test there.
Please note: You should use Apache JMeter version 2.9, because the latest 3.1 version isn’t stable with the JMeter Maven plugin v.2.1.0.
You can use the BlazeDemo Home Page test, just save it in the src/test/jmeter directory. When running the project, the JMeter Maven plugin searches for tests to run in this directory.
3. No you can execute your plugin by using Maven. Go to your project directory and run the following command in the command line:
mvn verify
As a result, you will see:

The test ran successfully! The raw results are located at /target/jmeter/results. You will find a report XML-file named “20170319-BlazeDemo Home Page.jtl”:
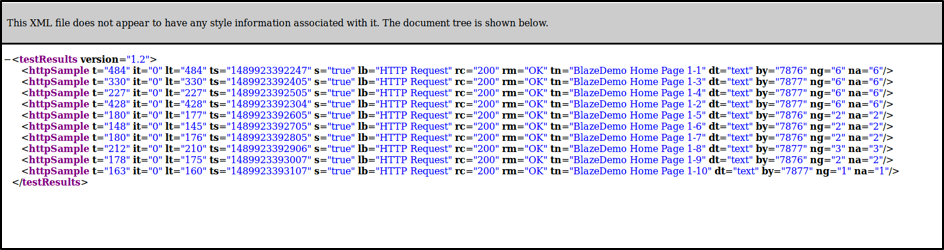
All http samples have attributes with the following meaning:
- t - Elapsed time (milliseconds) from the test beginning
- it - Idle Time. The time that is not spent for sampling (milliseconds) (usually is equal to 0)
- ts - timeStamp. The time counter beginning since midnight Jan 1, 1970 UTC (milliseconds)
- s - Success status (true/false)
- lb - Label of sampler
- rc - Response Code (e.g. 200). See more response codes from W3.
- rm - Response Message (e.g. OK) - a message coming with a response.
- tn - JMeter test’s Thread Name
- dt - Provided data type
- by - Request bytes
- ng - Active threads number in current group BlazeDemo Home page
- na - Active threads number for all thread groups
Phase 4 - Viewing the Results in a Graph
If you want to look at your results more visually, you can represent them as a graph. This goal is achieved with the help of the JMeter Graph Maven plugin, which allows you to create beautiful graphs by using JMeter .jtl output files.
Let’s try it step by step:
1. First of all, add the plugin to your maven project pom.xml file. It would look like this:
 xmlns="http://maven.apache.org/POM/4.0.0"
xmlns:xsi="http://www.w3.org/2001/XMLSchema-instance"
  xsi:schemaLocation="http://maven.apache.org/POM/4.0.0
http://maven.apache.org/maven-v4_0_0.xsd">
  4.0.0
  com.example
  jmeter-testproject
  jar
  1.0-SNAPSHOT
  jmeter-testproject
  http://maven.apache.org


      junit
      junit
      3.8.1
      test


		com.lazerycode.jmeter
		jmeter-maven-plugin
		2.1.0


		    jmeter-tests

			jmeter


		de.codecentric
		jmeter-graph-maven-plugin
		0.1.0

	${project.build.directory}/jmeter/results/20170319-BlazeDemo Home Page.jtl


		      ResponseTimesOverTime
		      800
		      600
		      ${project.build.directory}/jmeter/results/BlazeDemo Request.png
Notice that here we need to set the inputFile parameter equal to our .jtl file.
2. Now, you need to make a small change to your JMeter test. Open the JMeter GUI, go to your Thread Group configuration window and set the “Loop Count” parameter equal to 100, as shown below:
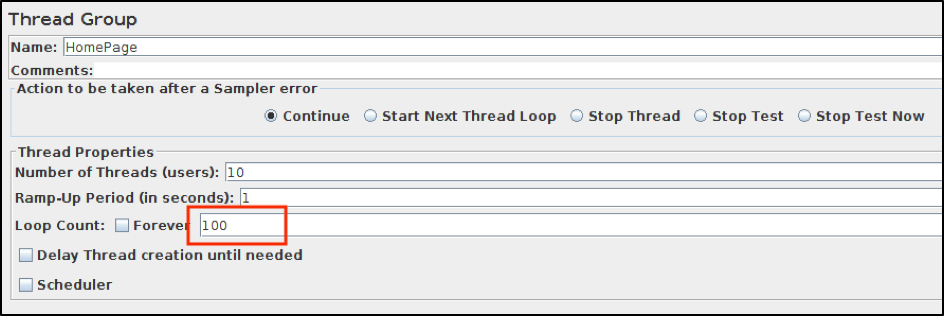
This provides you with the ability to execute your threads requests 100 times. You need this to make test execution longer, so you can see noticeable changes on your result graph.
3. Finally, open the command line, go to your project directory and then type following command:
mvn jmeter-graph:create-graph
In your /target/jmeter/results directory you will see the graph BlazeDemo.png:
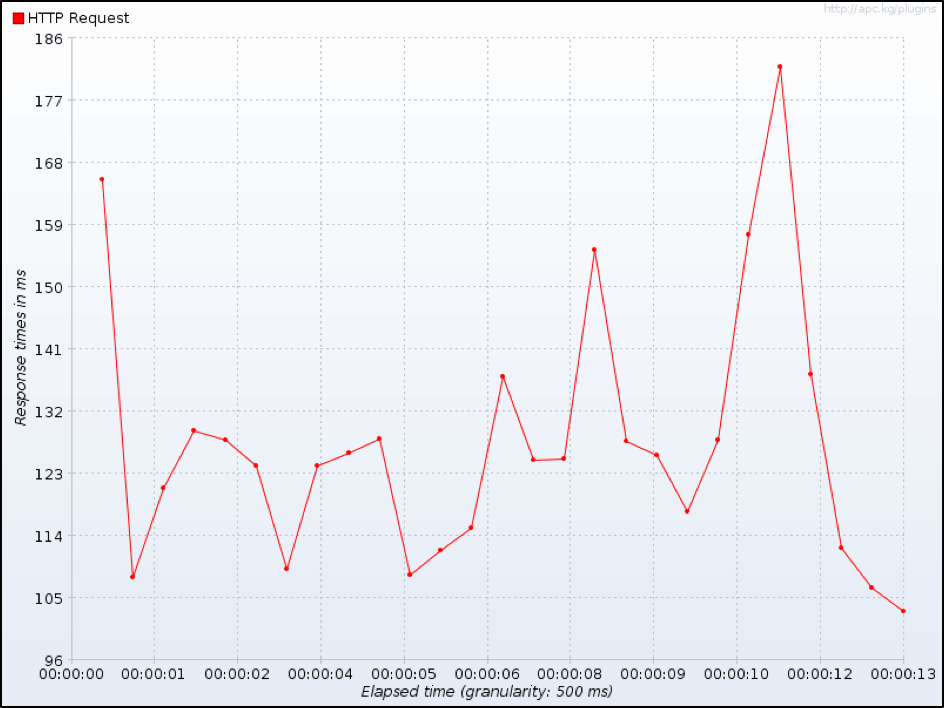
This shows you changing of response time during test execution. By running your test through BlazeMeter, you can also view and analyze your results through rich and colorful graphs.
That’s it! Now you know all necessary information about how to use JMeter Maven plugin. To learn more about using JMeter check out BlazeMeter University.