Blog
November 1, 2020

Postman is a tool for sending requests to API endpoints. It also provides lots of useful functionalities on top of the main HTTP requests like API documentation, monitoring, and simulating a mock server.
In this blog post I will show you how to use Newman + Postman. To do that, I will test a sample API from Postman, which is a simple GET request.
Back to topWhat Is Newman in Postman?
Back to topNewman is a command line executor for Postman tests, enabling you to make Postman's open-source API testing tool more powerful by running a Postman collection from the command line. Using Newman allows teams to integrate API test automation into Continuous Integration tools.
Creating a Postman Collection
First of all we need to create our first collection in Postman. In this collection we should include all the API tests we created for this sample API. This is what it looks like:
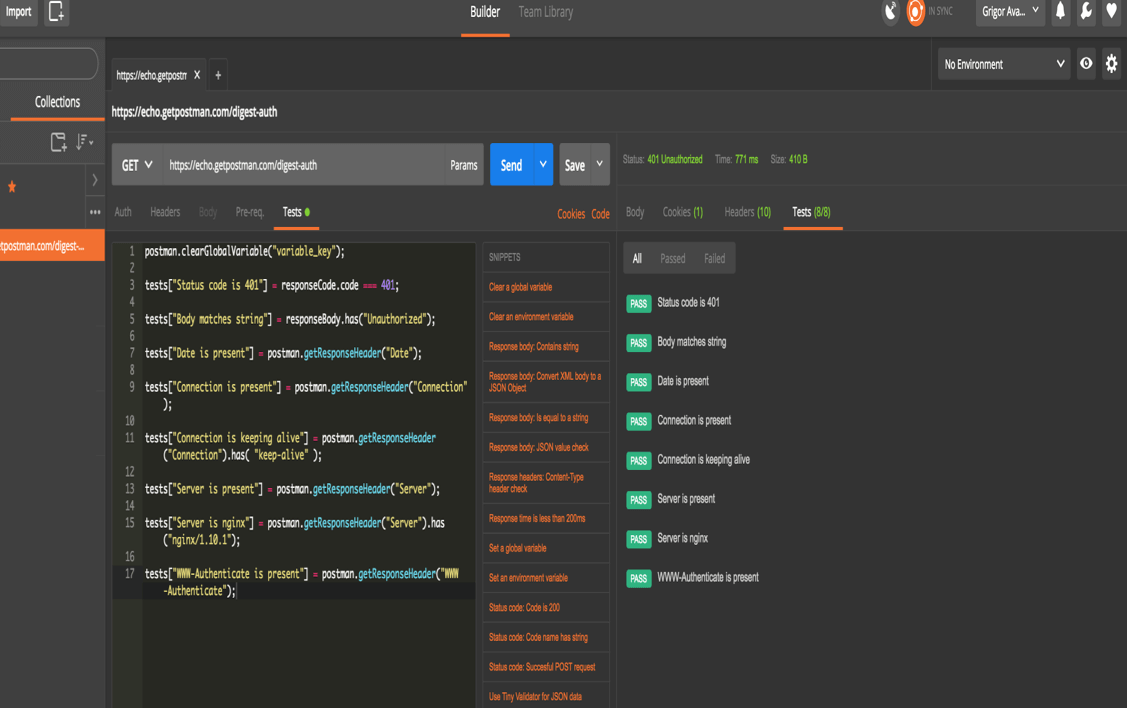
Here are the tests:
postman.cleanGlobalVariable("variable_key")
tests["Status code is 401"] = responseCode.code === 401;
tests["Body matches string"] = responseBody.has("Unauthorized");
tests["Date is present"] = postman.getResponseHeader("Date");
tests["Connection is present"] = postman.getResponseHeader("Connection");
tests["Connection is keeping alive"] = postman.getResponseHeader("Connection").has("keep-alive");
tests["Server is present"] = postman.getResponseHeader("Server");
tests["Server is nginx"] = postman.getResponseHeader("Server").has("nginx/1.10.1");
tests["WWW-Authentication is present"] = postman.getResponseHeader("WWW-Authenticate");
A couple of words about the tests. When using JavaScript in Postman (you can also use other languages), there are some predefined JavaScript code widgets that should be used. For example this one:
tests["Status code is 200"] = responseCode.code === 200;
With a slight change, it looks like this:
tests["Status code is 401"] = responseCode.code === 401;
Now we can make sure that our API GET request is responding with the 401 HTTP code. The power behind this is JS, making is quite easy to write many tests for specific coverage, including schema validation for a JSON response body, and much more.
Ok, let’s say we finished collecting our tests together, what’s next? We can easily rerun them as many times as we need. But wait, that’s manual, isn’t it? Yes, we need to test automatically, because in the 21st Century manual testing is… no, I will not comment on that.
As a first step, we need to export our Collection to a JSON file in Postman format. To do that, highlight your collection and then click on “Export”.
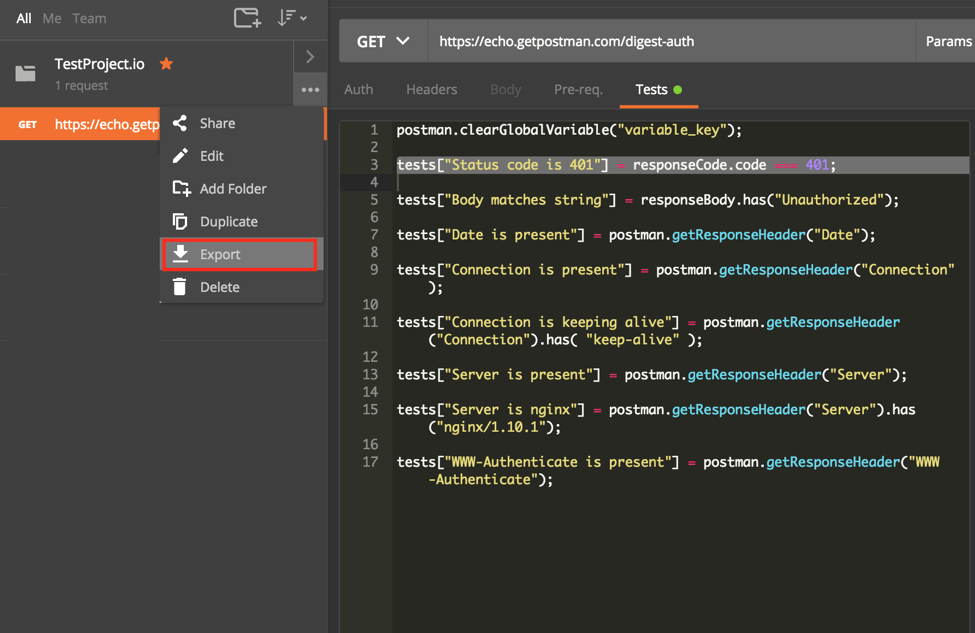
Now, save the file in any preferred location and name it as you like. I will do it in ~/Projects/Postman/getPostmanAuth.json.
Back to topInstall & Run Newman in Postman
Now we need to install Newman in Postman. Simply follow the steps.
When you’re done open the command line and navigate to the path of the just exported json collection file.
For me the command will look like this:
cd ~/Projects/Postman
Here, the magic begins! Run the Newman command in Postman:
newman run getPostmanAuth.json
(Replace “getPostmanAuth” with your JSON file name.)
If you did everything correctly you will see this output:
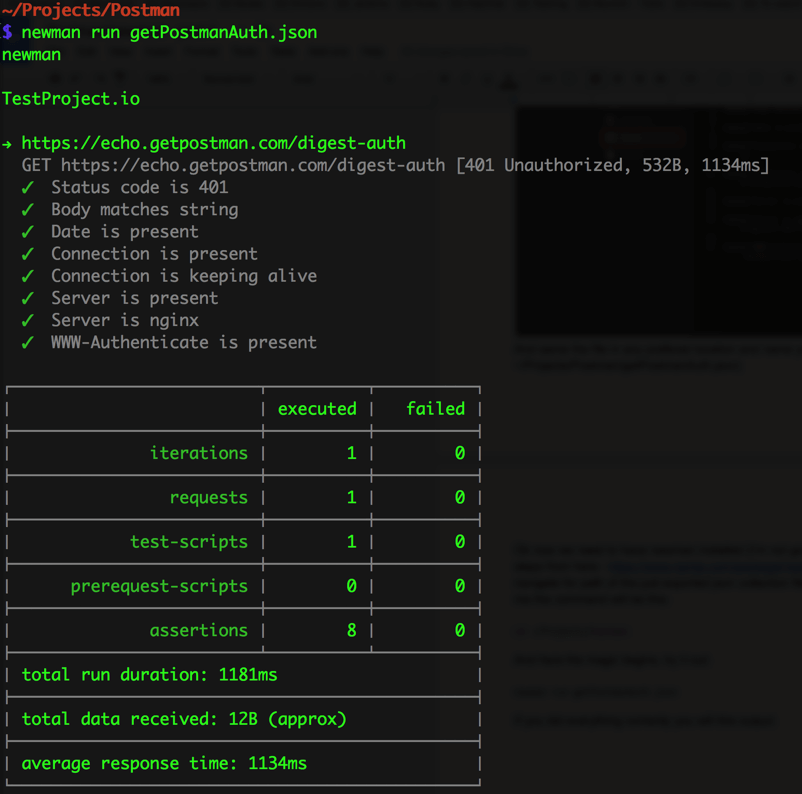
Cool huh? You can see the reports in your command line!
Ok, agreed, but stop, this report in STDOUT is fine enough, but we are in the modern world and we need to have cooler reports like HTML or JUnit formatted XML. Then, we will be able to put our new shiny Newman into CI systems, like Jenkins.
Back to topIntegrating Newman & Postman Into CI Systems
Let's try integrating Newman and Postman into our CI system. Here is the command:
newman run --reporters html getPostmanAuth.json
Then, you will see a new folder next to your Newman JSON file. Inside it, you will find the same data in a nicer report. In my case: newman-run-report-2017-02-12-14-48-36-139-0.html. Try to open it in a browser, e.g. Google Chrome:
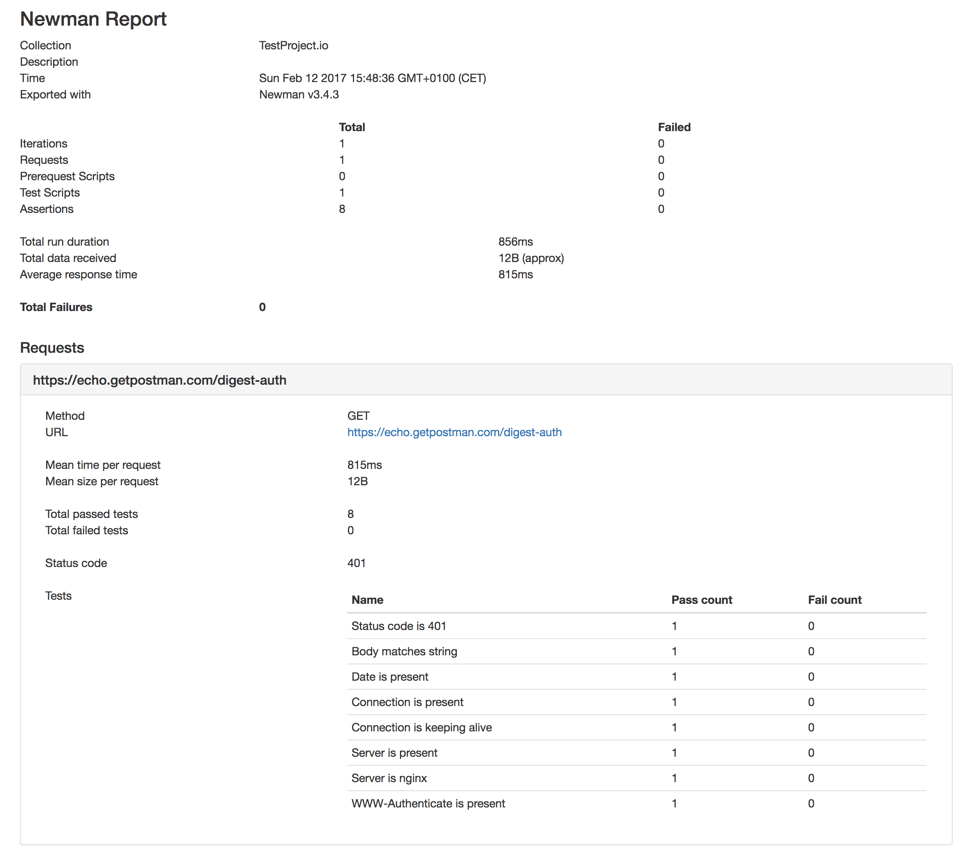
This is already ready to be included in Jenkins, or any other CI system.
You can also use JSON and JUNIT/XML reporters in Jenkins. To do that, go to Post-build Actions on Jenkins in one of your jobs or by creating a new job:
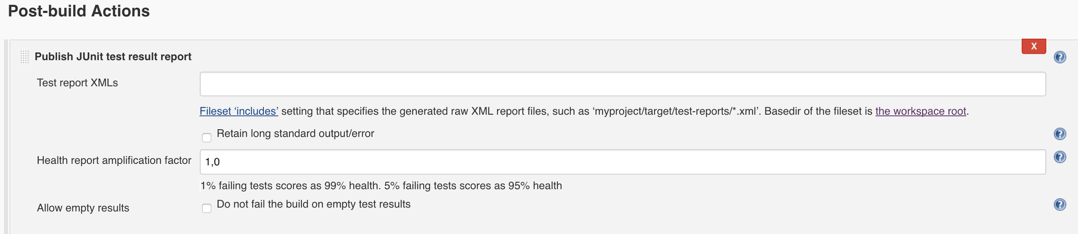
To generate the JUnit XML that will be put in the “Test report XMLs” field, run this command:
newman run --reporters junit getPostmanAuth.json
The result will be in the same folder as all the other reports, with a name like this: newman-run-report-2017-02-12-14-54-40-145-0.xml. It will already be properly formatted into a JUnit publisher ready file:
<?xml version="1.0" encoding="UTF-8"?>
name="TestProject.io">
name="https://echo.getpostman.com/digest-auth" id="290f0256-08b3-403c-896d-79ac5607c5f0" tests="8" time="1187">
name="Status code is 401"/>
>
name="Date is present"/>
>
name="Connection is keeping alive"/>
>
name="Server is nginx"/>
>
</testsuite>
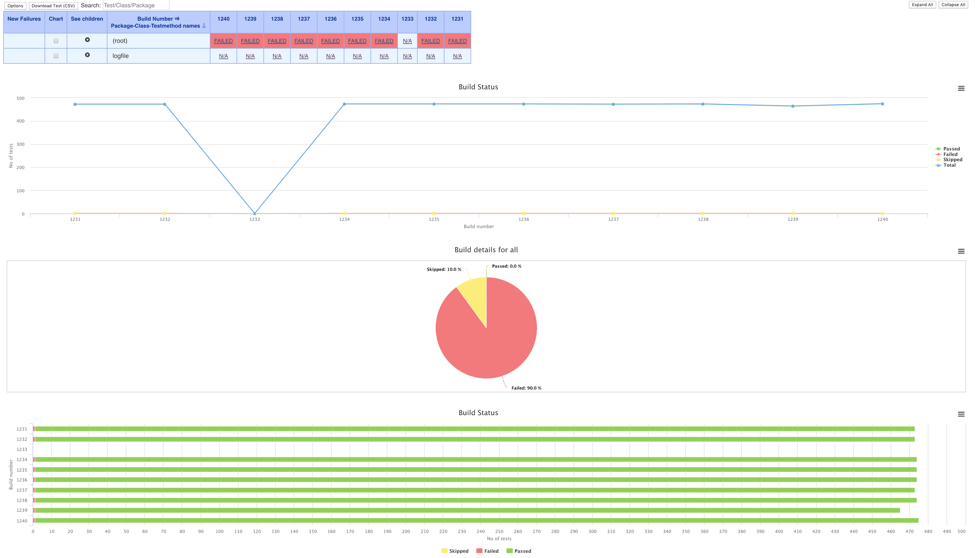
testsuites>Now run the test and view the results:
You can also run JSON reports on monitoring systems like Elastic Search and Kibana, by running:
newman run --reporters json
getPostmanAuth.json
Thanks for reading about Newman in Postman! Now, get started testing with BlazeMeter today.