Blog
January 13, 2020
Docker + Grafana + InfluxDB: How to Create a Lightweight Monitoring Solution

Performance Testing
We are fortunate to have many options today for performance monitoring, from open-source solutions to the most robust commercial testing platforms. This blog will cover how to set up a performance monitoring solution using Docker, Grafana, and InfluxDB. Then, I will show you how to use this solution later to monitor any test scripts written in any performance test tool.
Back to topWhy Docker + Grafana For Monitoring Tests?
For those who like building solutions from scratch, combining open-source tools like Docker, Grafana, and InfluxDB is a great option for monitoring any test scripts written in any performance test tool.
Some of us who have been working in software performance testing for a long time might still remember the days when the only way to analyze your performance tests was to wait until test execution was over, test reports were created and distribution graphs were drawn. Fortunately, these days are far away from us. Now, we can run performance tests and get feedback instantly, and even choose among many available options how to monitor and analyze our performance testing scripts.
Some of us prefer to use monitor performance scripts by using inbuilt performance tools capabilities that we can find in Apache JMeter™, Locust, Gatling, and a list of other tools. Others prefer to work with powerful testing platforms like BlazeMeter, where you can monitor and analyze your performance scripts without literally any additional effort spent on advanced monitoring configuration. Also, there might be some of us who already have some in-house tools inside their company designed to monitor the load scripts in progress. The rest either like or have to build everything from scratch, depending on their current infrastructure, budget, and needs.
There are many articles on the web that cover monitoring-related topics. Unfortunately, when I was doing the research myself, I couldn’t find any ready-to-use guide that would help me establish a lightweight monitoring solution from scratch in a short time.
That's why I established two goals for my article. First, to make a ‘ready to go’ solution with Docker, Grafana, and InfluxDB that will take no more than 10 minutes to set up for monitoring your scripts. Second, to offer a very clear tutorial so developers can customize this solution later for their needs.
Back to topUsing Docker to Install Grafana & InfluxDB
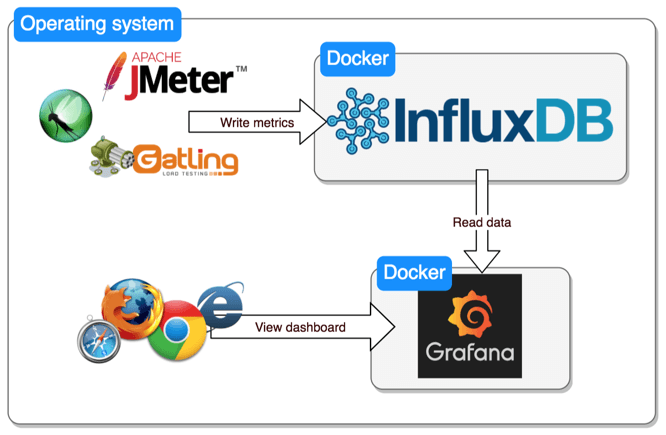
For our solution we chose the most powerful tools designed for all kinds of monitoring:
- InfluxDB - an open-source time series database for enhanced analytics
- Grafana - an open-source platform for data visualization
A combination of these tools can provide you with outstanding monitoring and analysis abilities of your performance scripts. There are many options to install both of these tools separately or together, but the most efficient is by using the Docker technology. As soon as you have built the docker file that contains all the tools integrated together in the right way, it takes just a few minutes to spin up these tools anywhere and by anybody. In fact, we have good news for you. We have already cooked up such a Docker file for you so you can spin up the whole infrastructure for monitoring in just a few minutes.
Back to topDocker & Grafana Setup Prerequisites
As always, there are some prerequisites. However, if you are already a more or less advanced engineer, then you should already have all the below prerequisites. In order to use the prepared docker file, you need to have the following installed:
- Docker: to spin up the containers with InfluxDB and Grafana. Follow the installation steps.
- Docker Compose: to integrate the InfluxDB and Grafana containers together and have just one script to rule them all. Follow the installation steps.
Performance Monitoring Setup
If you have Docker and Docker Compose installed, then to set up the performance tests monitoring environment you just need to proceed with a few simple steps:
- Step 1: Open the console
- Step 2: Navigate to a preferred location
- Step 3: Run the command: > git clone
- Step 4: Run the command: > docker-compose up
- Step 5: Relax and wait 30-60 seconds… If you see a similar output then you are good:
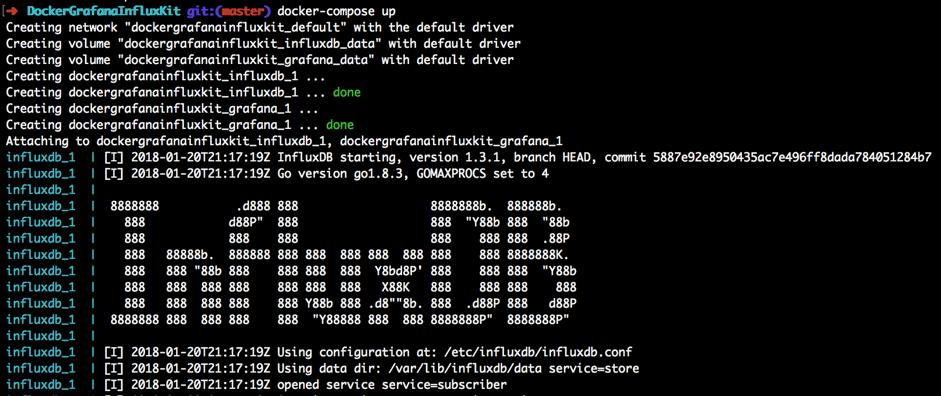
That’s basically it! From this moment you have these Grafana and InfluxDB containers running locally on your machine:
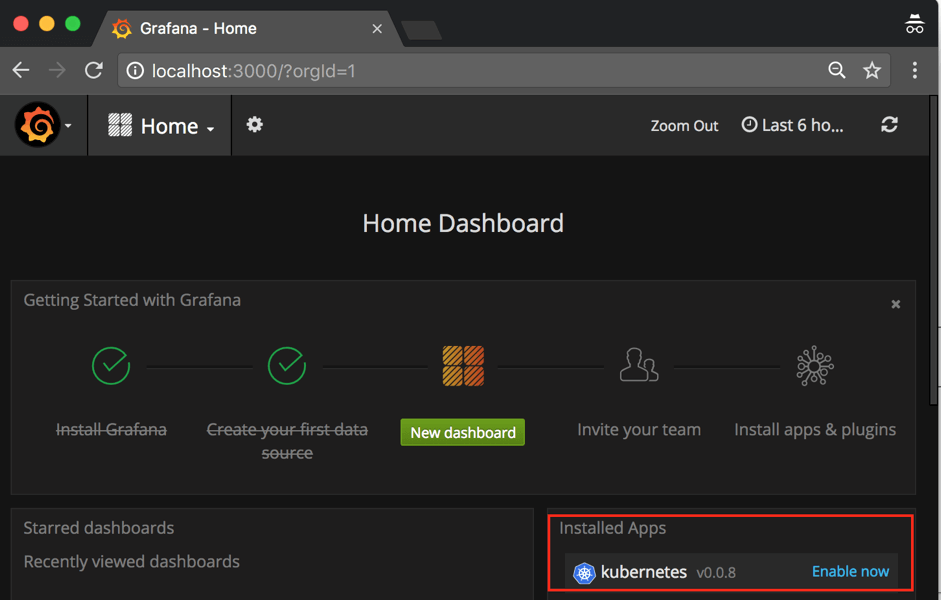
Open the localhost after the installation and you should see your Grafana:
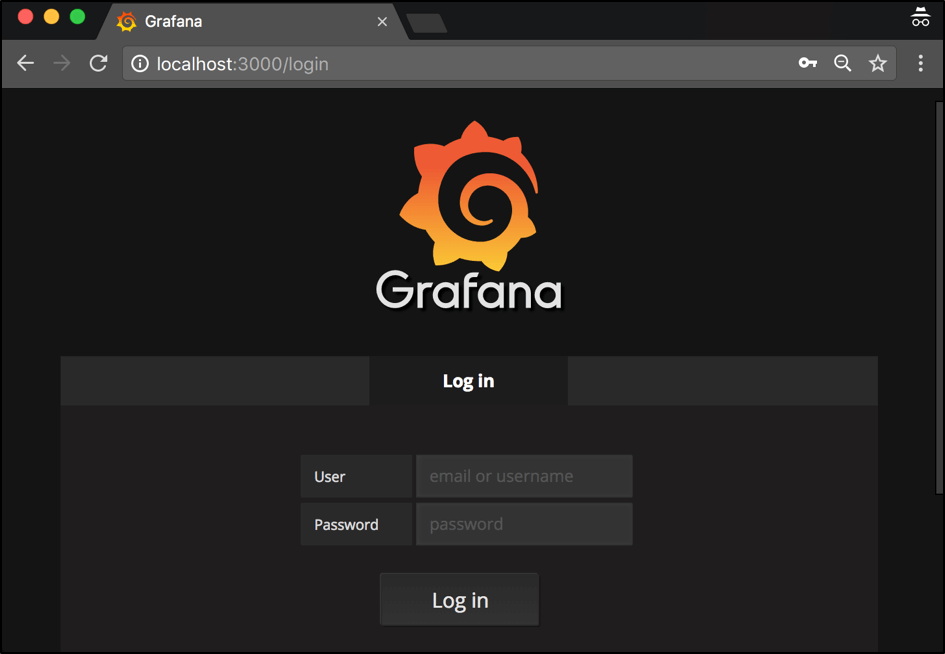
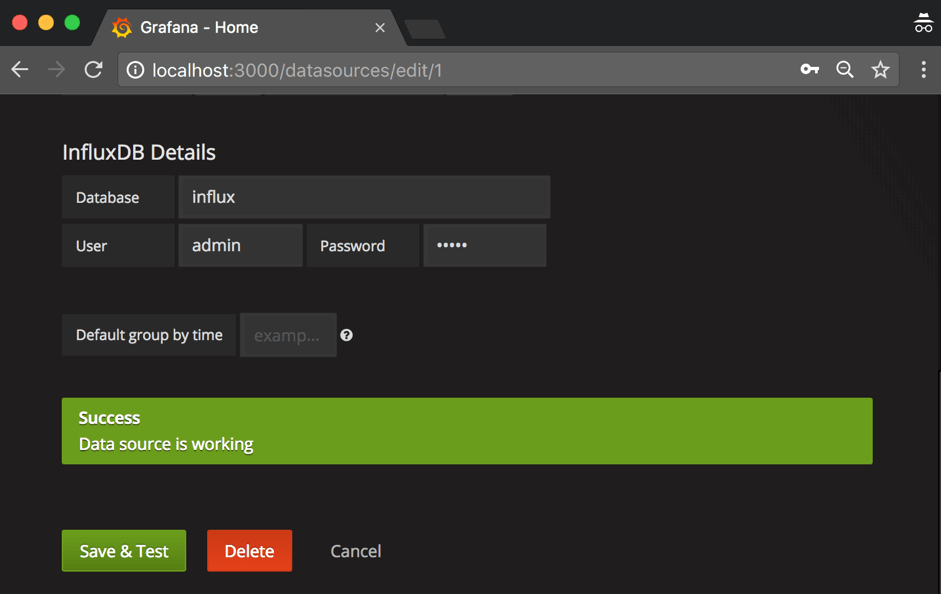
You can log in using the default user ‘admin’ and ‘admin’ password (yes, security is not the highest priority in this article but you can change the credentials later). Also, if you go to the Grafana data sources configuration (Left top menu button -> Data Sources) you will see that the installed Grafana already has an in-built configuration with an InfluxDB instance that we are running in a separate Docker container:
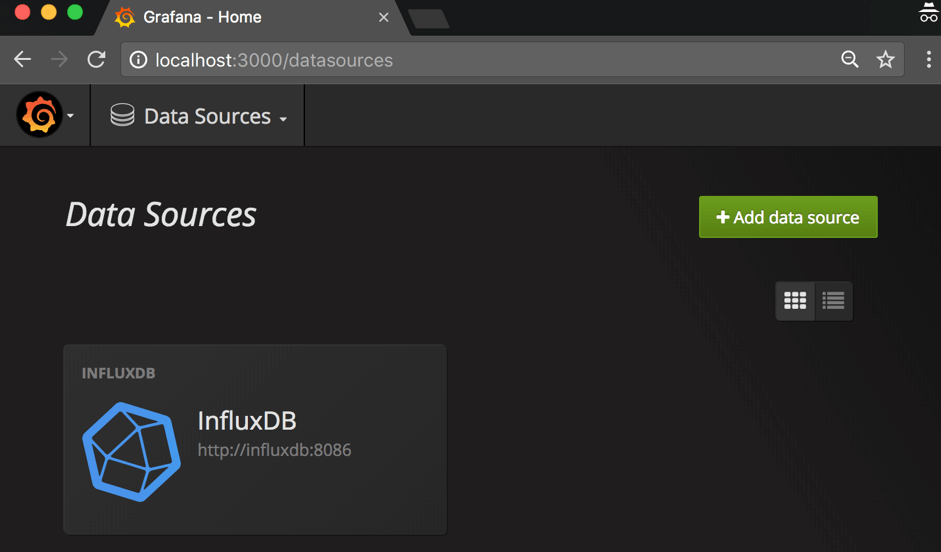
To be 100% sure that the integration works correctly, you can click on the ‘InfluxDB’ data source, scroll down to the end of the page and click on ‘Save and Test’. If you got ‘Data source is working’ then relax, your lightweight monitoring environment is ready and verified!
At this point, you can treat your setup as ready and we have everything to perform your test monitoring. If everything went well then the whole setup took no more than 10 minutes. Now, in order to establish performance tests monitoring, all you need is to push performance metrics to InfluxDB with these parameters:
- Host address: ip address of your machine
- Database port: 8086
- Database name: influx
- Database user name: admin
- Database password: admin
Many articles would end at this point but we have one more goal to achieve. We need to clarify all the details of this solution because it is important for you to be able to customize it for further needs. If you are an advanced Docker user, you can skip the rest of the article and try out your new monitoring tools. In any other case, let’s continue.
We are not going to cover the full theory about Docker and Docker Compose as you can find lots of more relevant sources to get a better knowledge of these tools. But we will go over some of the basics and show you how you can take all the required actions with our docker containers: running the containers together and installing plugins. Later, I will show you how to write queries with the InfluxDB functionality.
Back to topSetting Up & Integrating InfluxDB and Grafana With Docker
Some Basic Theory About Docker
Briefly, for those of you who don’t know, Docker is a simple way to deploy and run software applications. Docker provides you with lightweight isolated containers that behave like a virtual machine, but at the same time share the OS where they have been run. In comparison with virtual machines, Docker allows you to spin up lots of isolated dockers without any additional resources cost.
In our solution, which you just ran, we used two different containers. The first container runs Grafana for showing dashboards, while the second one runs InfluxDB for storing metrics. I would recommend going over a Docker tutorial, which is very handy for those of you who are not familiar with Docker yet.
But why do we need Docker Compose in this case? Docker Compose is designed to combine multiple dockers in one standalone composition, which you can run through one command. This is very convenient when you need to run different containers together in integration. In our case, we need to run two different applications (Grafana and InfluxDB) and that’s why it makes sense. You can read about Docker Compose in an orchestration overview.
Our Monitoring Setup Structure
As we mentioned before, the best way to start will be to check out our ‘ready to use’ project. Let’s go over the structure of our monitoring setup:
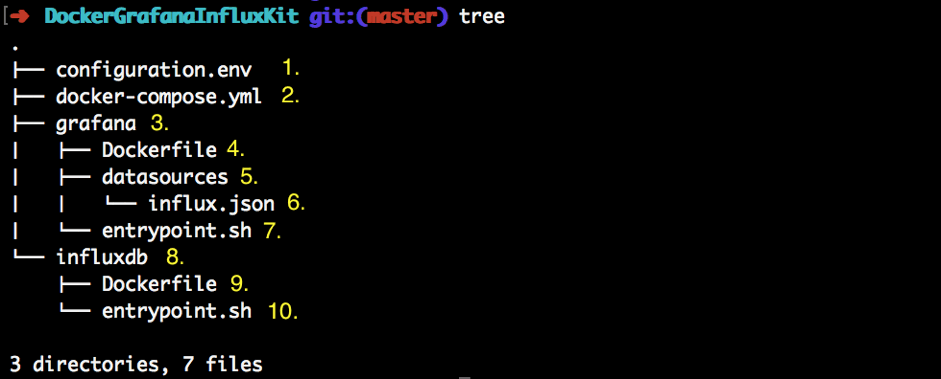
1. The main configuration file for the whole monitoring infrastructure which contains the most important parameters we might want to change like the user/password for Grafana/InfluxDB or the list of Grafana plugins.
2. The Docker compose file that contains the description of docker containers to run.
3. The directory with files related to Grafana Docker.
4. The Grafana Dockerfile that contains the full description of the Grafana Docker container.
5. The directory with configuration files related to predefined data sources (sources of data metrics for Grafana dashboards).
6. The configuration for our InfluxDB data source, which already has all the required configs specified in order to run Grafana and InfluxDB in integration without any additional configuration.
7. The initial shell script that contains all the commands that should be run in the Grafana container during its startup.
8. The directory with files related to InfluxDB Docker.
9. The InfluxDB Dockerfile, which contains the full description of the Grafana Docker container.
10. The initial shell script that contains all the commands that should be run in the InfluxDB container during its startup.
Running the Docker Containers
As we showed before, in order to run the containers using Docker Compose, you need to run this command from the main folder where the ‘docker-compose.yml’ is located:
docker-compose up
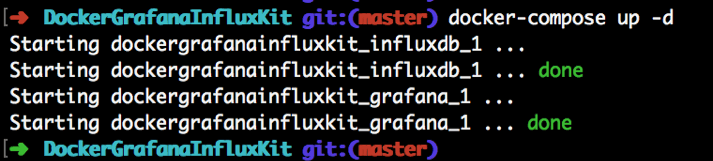
This command will spin up Grafana and InfluxDB integrated together. Using this command, the containers will be run in the console in a way that if you close the console, the containers will be stopped. Sometimes, it is handy to run containers in the background so you can safely close your console and containers will still continue to run. To run the Docker Compose in background mode, you need to pass the additional argument ‘-d’:
docker-compose up -d
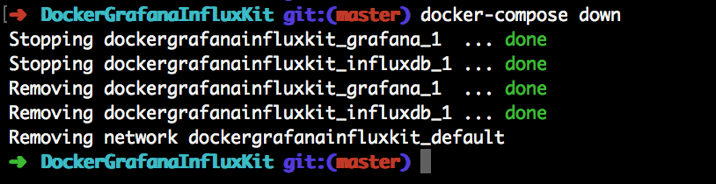
To stop the containers you can run the command:
docker-compose down
Docker Compose File Explanation
Let’s go over the Docker Compose file to get the main idea of its implementation. We can check the InfluxDB docker-compose file section. (The Grafana section has a very similar configuration so it doesn't make sense to go over the both of them in this article):
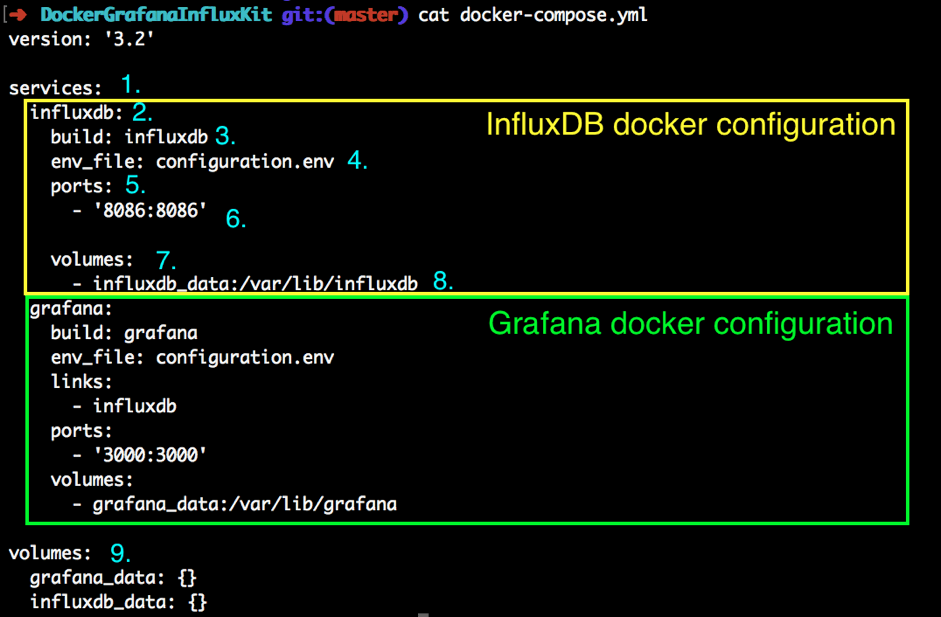
1. The services section shows the list of Docker applications that will be run under one docker infrastructure (in our case we have InfluxDB and Grafana dockers).
2. The InfluxDB docker section with detailed Docker configuration.
3. The location of the InfluxDB Docker that needs to be built (the name of the folder with the appropriate dockerfile and related files).
4. The Properties file with a list of parameters that should be sent inside the docker container.
5. The section with the ports you want to forward outside the docker container.
6. 8086 forwarding port - The InfluxDB HTTP port that is used to write and read metrics from and inside the InfluxDB database.
7. Volumes sections that contain the list of volumes to be used in order to persist the data for a specified container.
9. The Volume forwarding in which you specify the location of data to be stored inside the container.
Back to topHow to Install Additional Grafana Plugins
In our provided solution, the installation of new Grafana plugins is very easy and can be done in a few steps:
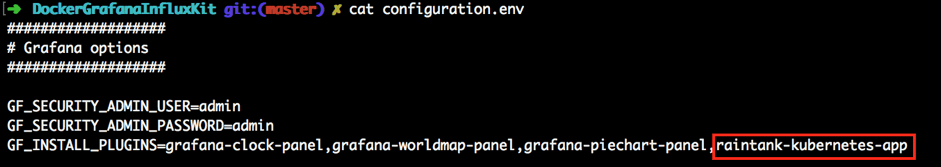
1. Choose the plugin you want to install.
2. Find the line that specifies the plugin installation command (for example, for the Kubernetes plugin the installation command will be “grafana-cli plugins install raintank-kubernetes-app”).
3. From the installation command we should copy the plugin name (the last word in the installation string. “raintank-kubernetes-app” in our case).
4. Add this name to the list of plugins specified under the “GF_INSTALL_PLUGINS” configuration key
5. After you made any changes inside the configuration files, you have to rebuild the docker compose integration, otherwise all of these changes will not be applied. You can rebuild docker compose using the command below:
docker-compose build
6. After this you can run your Docker Compose as usual and the new Grafana plugin will be installed automatically on your Grafana container:
How to Run InfluxDB Queries
In order to run InfluxDB queries, you need to log in inside the InfluxDB docker container. First, you need to get the list of all docker containers running. Use this specified command and find the container id related to the InfluxDB container (it should have the ‘influxdb’ string inside the container name):
docker ps

Next, we are going to use the command that allows running a specified command inside the container. The last two values are arguments that represent the ID of the container and the command that will be run inside the container with the specified ID:
docker exec -it [YOUR_INFLUXDB_CONTAINER_ID] influx
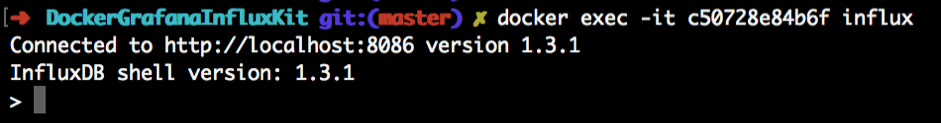
If everything is right, you should see the InfluxDB command line client that allows you to execute InfluxDB requests:
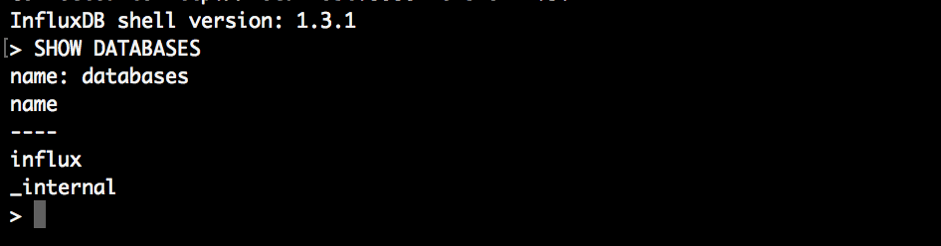
Get a full explanation of powerful InfluxDB syntax, which you can use to write or request data directly to or from InfluxDB.
Performance Test Metrics Storage and Analysis
You are now running the whole Docker Grafana InfluxDB infrastructure on your local machine! So all you need to do to start monitoring is to push the performance metrics from the performance tool to your InfluxDB instance. You may also want to learn more about JMeter and Gatling performance testing frameworks.
Bottom Line
In this article, we have tried to give you a very lightweight integration of Grafana and InfluxDB, by using the Docker technology that can be used for monitoring and storing the test metrics of your performance scripts. In addition to that, we went over the main concepts and steps that might be useful for you as soon as you want to customize the current project for your further needs.
But for those looking to take your open-source technology to the next level, BlazeMeter is a great option for running your performance tests in the cloud.
With BlazeMeter, you get:
- Simple Scalability. It’s easy to create large-scale JMeter tests. You can run far larger loads far more easily with BlazeMeter than you could with an in-house lab.
- Rapid-Start Deployment. BlazeMeter’s recorder helps you get started with JMeter right away, and BlazeMeter also provides complete tutorials and tips.
- Web-Based Interactive Reports. You can easily share results across distributed teams and overcome the limitations of JMeter’s standalone UI.
- Built-In Intelligence. The BlazeMeter Cloud provides on-demand geographic distribution of load generation, including built-in CDN-aware testing.
Try testing with BlazeMeter today.