The thing about data is that it can be messy.
When running a performance test, large amounts of data are being generated as a result. Most of the data points align with preconceived notions about how the test will run and what information will be there at the finish line.
The interesting part is when data points lie significantly outside of what had been expected. These are called anomalies. Anomalies in test data can either be a sign that the system under test (SUT) has issues that need to be addressed or they are the result of a problem with the test itself or the infrastructure on which the test is run. As a consequence, results are skewed, finding the root cause during analysis of the results becomes difficult and you are wasting time and resources.
BlazeMeter’s new features to support identifying the root causes for outliers and anomalies help testers to identify issues and take the right actions much more quickly and ensure that your attention is on the right issues.
In this blog, we will define what anomaly detection is, challenges testers face with manual anomaly detection, and the benefits they receive when it is automated.
What is Anomaly Detection?
Anomaly detection is the process of identifying rare occurrences or significant outliers in a set of data that deviate from the majority.
In performance testing, anomaly detection locates data points or instances within the test that lie outside of the testing objective. Anomalies in performance tests are either an indication that your test successfully identified issues in the application/system under test or that there are issues with your test script, configuration, testing infrastructure, or networking infrastructure.
The Challenges of Manual Anomaly Detection
With potentially thousands of data points to scour through, finding and categorizing anomalies and then identifying the root cause and the right action to take manually can be difficult and time-consuming and close to impossible if there are not enough resources with the necessary skills available.
When a performance test has concluded, the tester is tasked with analyzing all anomalies in the test results to ensure nothing important gets overlooked and at the same time only true anomalies remain (sorting out false positives) to make the analysis concise and cohesive.
To successfully conduct this analysis, data from different representations must be correlated. For example, drilling down from aggregated high level data points to a representation over time to identify periods of time where anomalies started occurring and matching these with data from log files to identify potential infrastructure issues.
Correlating data across different views/representations can be difficult.
How BlazeMeter Supports Users
Trimming Test Reports
BlazeMeter’s new Anomaly Detection reduces the tedium of manual anomaly detection. Leveraging the power of AI, this functionality enables testers to trim their performance test only one time and receive a holistic view of the test through all applicable report tabs.
Where identifying a specific time and date within a test had been tedious and difficult, now testers can enter a start and end time into the Input Field — trimming the test easily and accurately.
Multiple Timeline Reports
Traditionally, in order for BlazeMeter users to analyze their tests on the Timeline Report tab, they would have one timeline chart for all the data points they were tracking. That may not be an issue if a simpler test is being executed — with, for example, two to three metrics selected.
But when it came to more complex tests with sometimes dozens of metrics tagged in one timeline report, the chart became far too busy and difficult to parse through all the data points. With Anomaly Detection Infrastructure now in place, users can create multiple charts within the Timeline Report tab to better sort through and analyze their data.
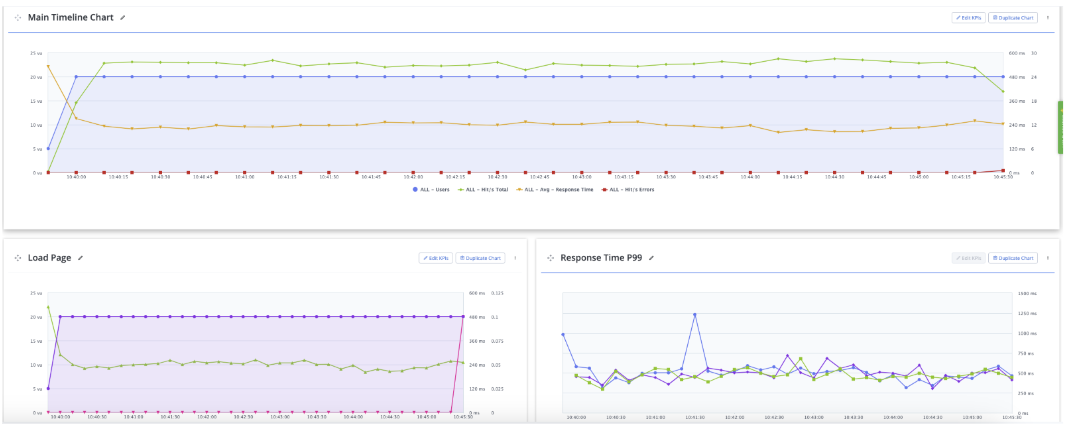
Users can add more charts, name them, and even order them in the most convenient layout. With multiple timeline charts, users can now distribute the labels and KPIs between the different charts on the page. The report analysis process becomes faster, visualization becomes clearer, and conclusions are easier to highlight and share.
Easier Report Analysis
The ability analyze an error and understand how to fix it used to be a tedious, time-consuming process. Users could only see the label identifying where the error occurred. However, in order to access it, they needed to download the artifacts.zip to their local machine, open the error.jtl file, and search for the specific error manually.
BlazeMeter now allows users to stay within their Errors tab to analyze a specific error without having to relocate to a different tab. The Errors tab now includes a new column called “Response Body"; BlazeMeter saves and displays unique error response bodies for each combination of label+error code+description. Users can save up to 10 unique error bodies for each combination.
Bottom Line
Identifying anomalies in the large amounts of data that result from running a performance test is time consuming and requires advanced skills to be able to separate false positives from issues that are business critical. In addition, data is messy and searching for the needle in the digital haystack is not justifiable anymore in the age of AI and Machine Learning.
BlazeMeter’s advanced capabilities help you cut to the chase and get to the root cause as fast as possible. Start using BlazeMeter as your personal advisor that makes analyzing test results like an expert easy as pie. Get started with BlazeMeter for FREE today!