Blog
September 27, 2021

The most common way to generate a load by using Apache JMeter™ is to run a script on the target number of threads. This is a good approach for many scenarios, when we know the number of active users, but we don’t know the level of requests per second (RPS) load.
Now, let’s imagine we have a task to test the throughput of a system. When we use regular Thread Groups in JMeter we need to play around with the number of threads and timers to achieve the necessary RPS load level. This isn’t an efficient or convenient way to generate a load.
So, how can we load test the RPS more efficiently?! The JMeter Throughput Shaping Timer plugin is one possible solution. This plugin is specially designed to schedule RPS loads. The Throughput Shaping Timer plugin adds the following features to JMeter:
- The Throughput Shaping Timer element - a timer that sets the desired RPS schedule via the JMeter GUI.
- Component Properties - Properties that contain information about the duration and current state of the test.
- Special Property Processing - A processing of the load_profile property, which sets the desired RPS schedule via the command line or properties files.
- A Schedule Feedback Function - A function that allows dynamic change of the threads number to meet RPS schedule
You can find the official page of the Throughput Shaping Timer plugin here, and download it. If you need help installing plugins you can find the information here: How to Install the JMeter Plugins Manager.
Great! Now let’s create a test script to demo the possibilities of the plugin.
Back to top
Load Testing Your Target RPS
1. Add a Concurrency Thread Group to the Test plan.
Test plan -> Add -> Thread (Users) -> bzm - Concurrency Thread Group
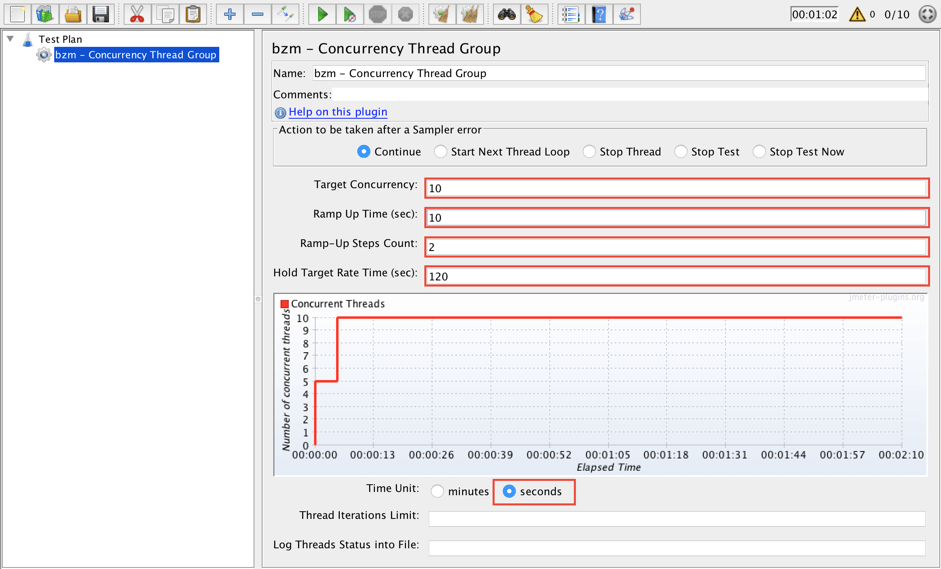
Fill in the following values:
- Target Concurrency: 10
- Ramp Up Time: 10
- Ramp-Up Steps Count: 2
- Hold Target Rate Time: 120
- Time Unit: seconds
This thread group will start 10 virtual users in two steps and hold it for 120 seconds. The total duration of the test should be 130 seconds according to this thread group.
2. Add a Dummy Sampler to mimic requests to the server.
bzm - Concurrency Thread Group -> Add -> Sampler -> jp@gc - Dummy Sampler
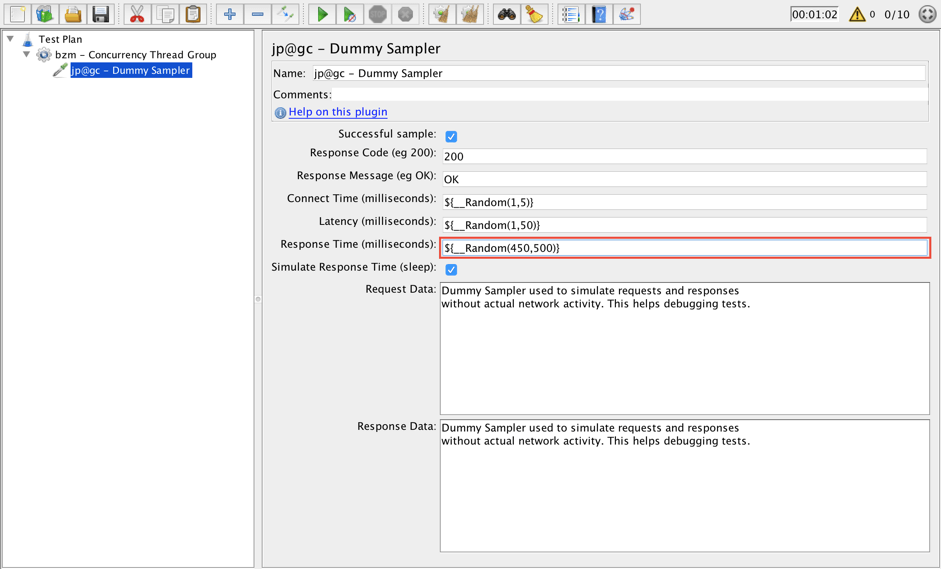
Update the following value:
- Response Time: ${__Random(450,500)}
This Dummy Sampler emulates a request to the server with a response time about 500ms.
3. Add a Throughput Shaping Timer to setup the RPS schedule. This timer will delay requests automatically to achieve our target RPS load level.
bzm - Concurrency Thread Group -> Add -> Timer -> jp@gc - Throughput Shaping Timer
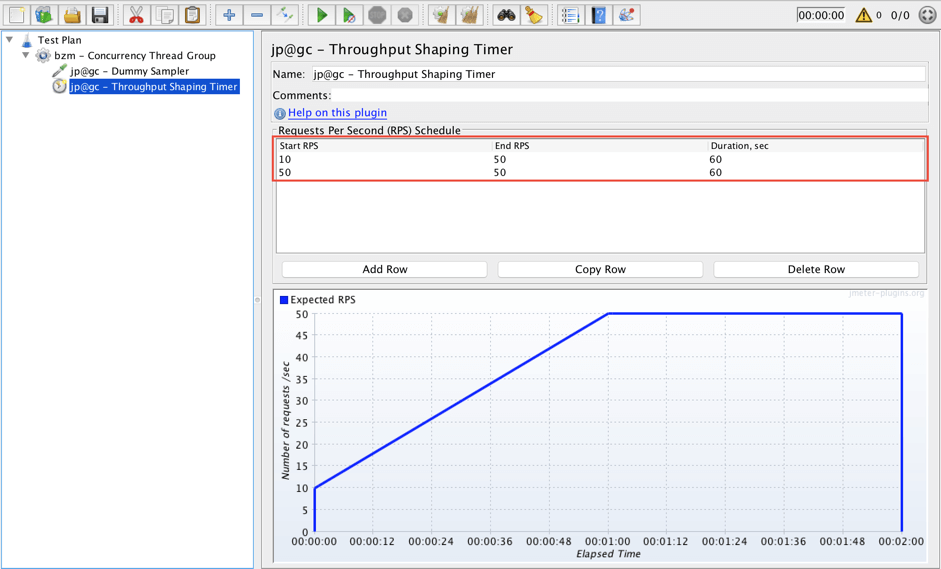
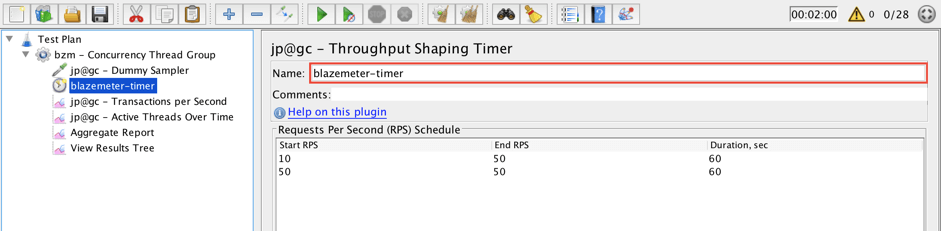
Add two rows to the Request Per Seconds (RPS) Schedule area:
- Start RPS: 10; End RPS: 50; Duration, sec: 60
- Start RPS: 50; End RPS: 50; Duration, sec: 60
The timer sets the schedule of the load, which you can preview on the graph. It is very convenient, isn’t it? According to this element, the total duration of this test should be 120 seconds.
4. Add some more listeners for future tests. These will help us to understand how the Throughput Shaping Timer works during these experiments.
- bzm - Concurrency Thread Group -> Add -> Listener -> jp@gc - Transactions per Second
- bzm - Concurrency Thread Group -> Add -> Listener -> jp@gc - Active Threads Over Time
- bzm - Concurrency Thread Group -> Add -> Listener -> Aggregate Report
- bzm - Concurrency Thread Group -> Add -> Listener -> View Results Tree
5. Our script is ready! Let’s run it.
According to the Concurrency Thread Group the duration of the test should be 2 minutes and 10 seconds. According to the Throughput Shaping Timer the duration of the test should be 2 minutes. The script stopped after 2 minutes. This shows that the script stops after the RPS schedule finishes. You should take this into account when you are working with the Throughput Shaping Timer. Also make sure that Thread Group duration is longer than Timer duration to avoid errors at the end of the test run.
Good. The test run is finished. Let’s check the results.
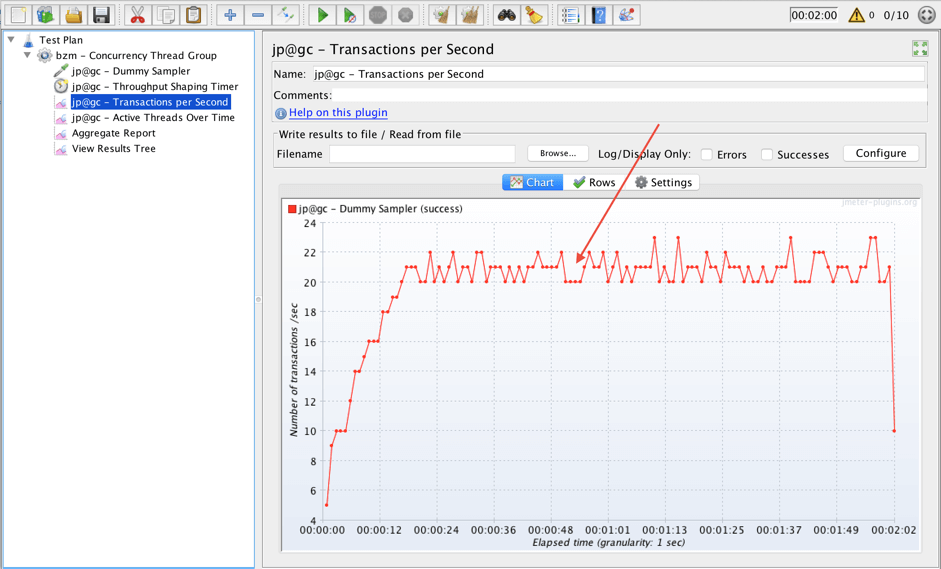
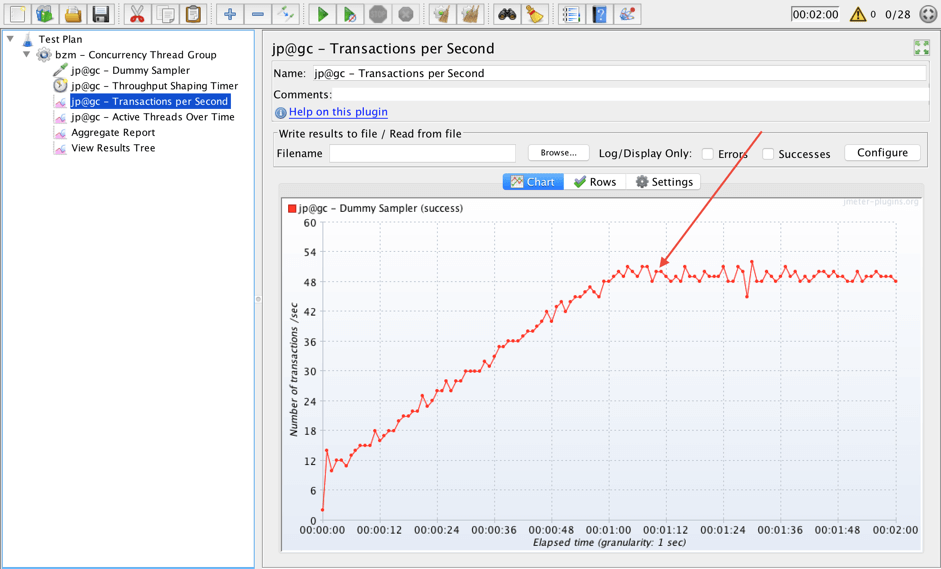
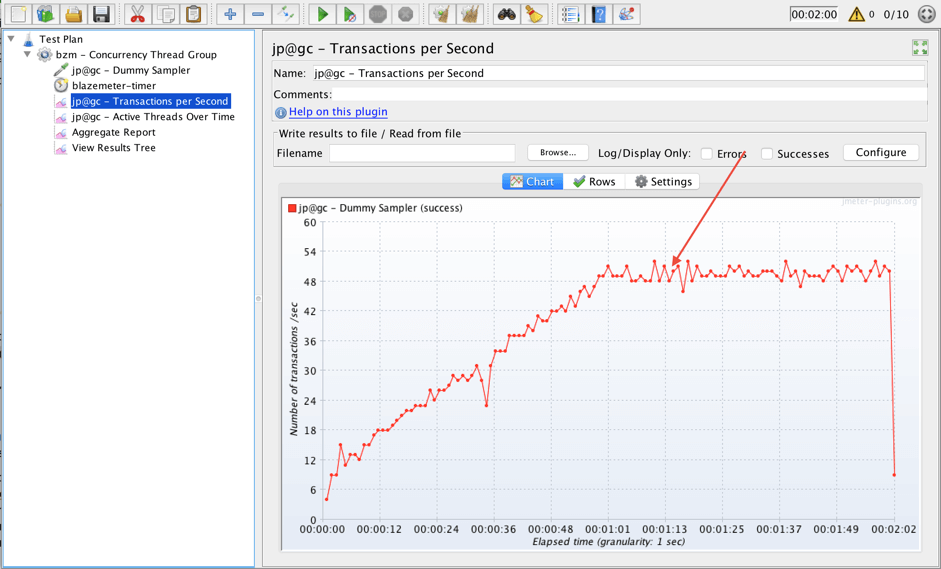
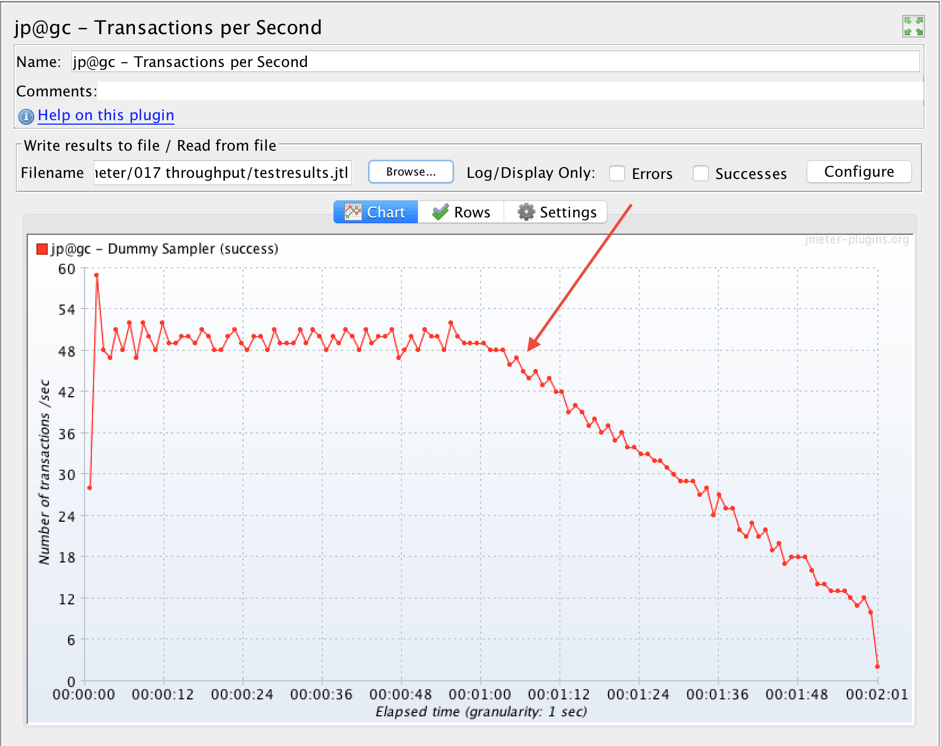
Look at the Transactions per Second listener. The expected load in 50 RPS wasn’t achieved. 10 virtual users were able to keep only about 21 requests per second. It also shows that the Throughput Shaping Timer can only delay existing threads and can’t add additional ones. Fortunately, there is a way to deal with this! We will learn how below.
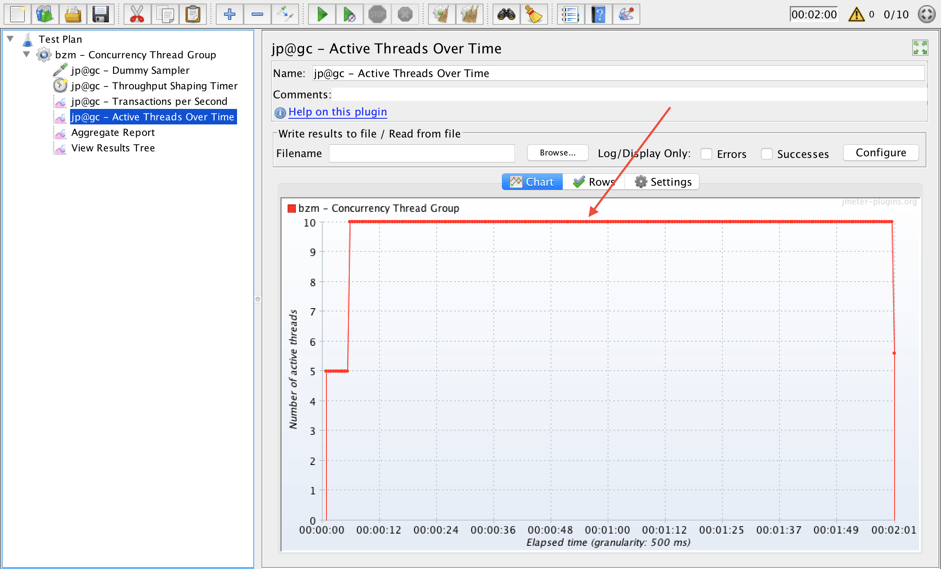
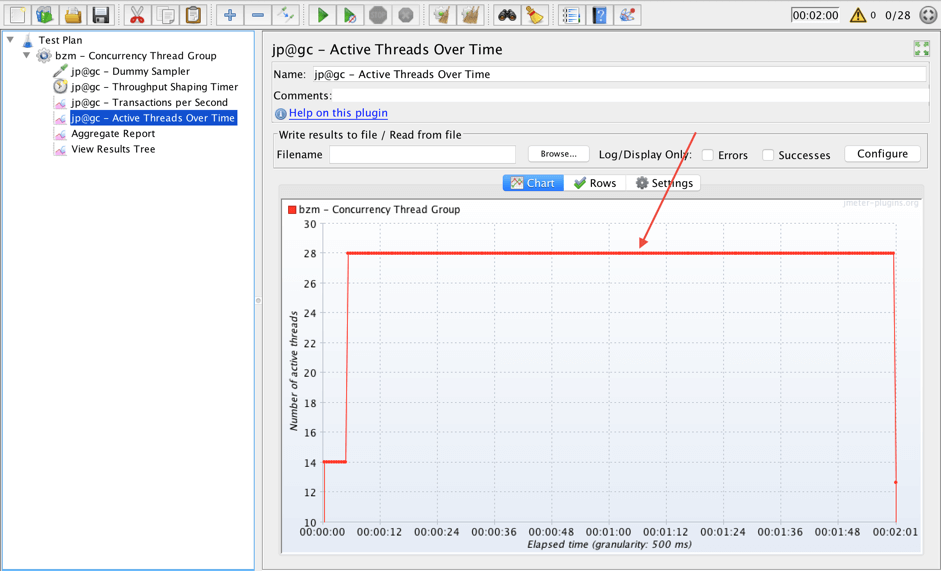
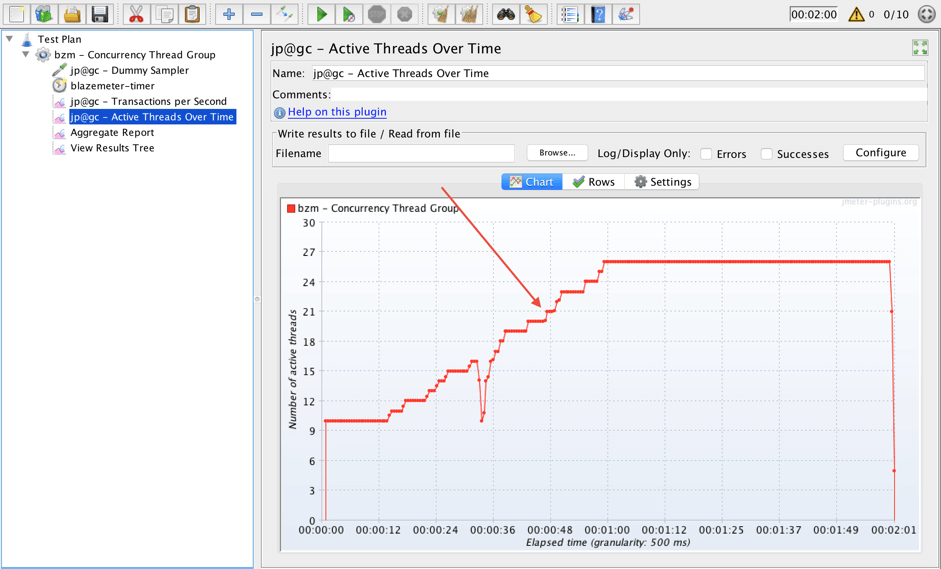
The Active Threads Over Time listener shows that all 10 allowed virtual users were started.
OK. So we can conclude that 10 active threads are not enough. But how can we determine the necessary quantity?
Back to top
How Many Threads Should You Run?
Here is a formula for that: Thread Pool Size = RPS * max response time / 1000
RPS is 50. Let’s find “max response time” in the Aggregate Report.
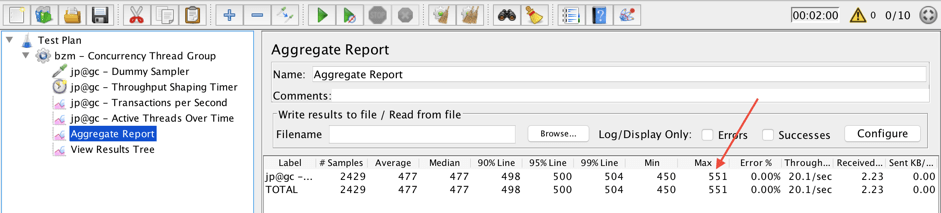
“Max response time” is 551ms.
Thread Pool Size = 50 * 551 / 1000 = 27.55
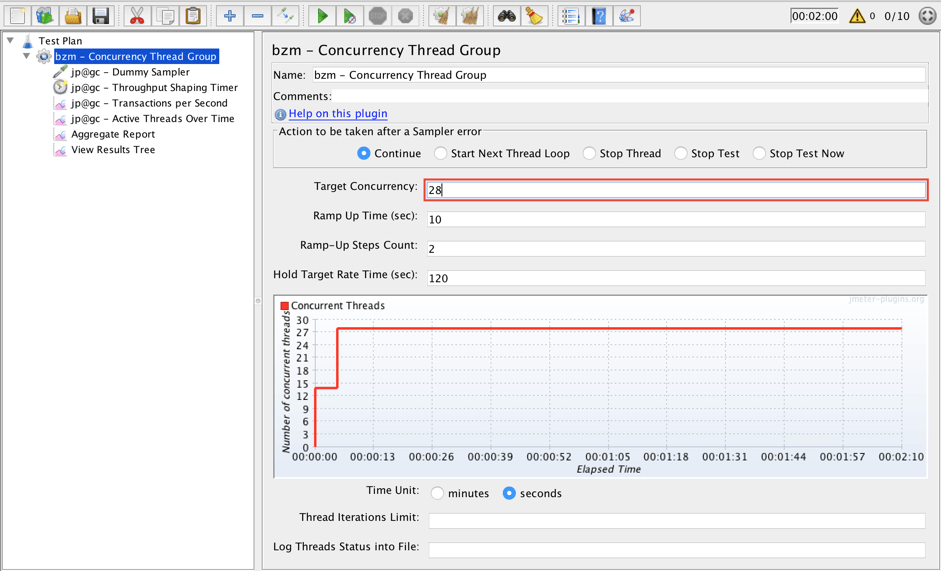
For simplicity let’s round the result up to an integer number. According to this formula 28 is the calculated Target Concurrency for our demo test. Let’s prove it!
6. Change the Target Concurrency according to the calculated value.
Update the following value:
- Target Concurrency: 28
7. Run the script again.
The expected schedule and max value of requests per second were achieved. So, our test passed just fine.
The Active Threads Over Time listener shows that all 28 virtual users were run during the whole test.
Back to top
How to Dynamically Determine the Thread Count
Is there any way to dynamically determine the thread count required to achieve the target RPS schedule? Luckily the answer that question is yes! This will also help to save some machine resources when we don’t need all virtual users to be active to achieve our target load. We should pair the Throughput Shaping Timer with the Concurrency Thread Group using the Schedule Feedback Function. Let’s try it in action.
8. Rename the Throughput Shaping Timer.
Set the following value:
- Name: blazemeter-timer
9. Open the Concurrency Thread Group element.
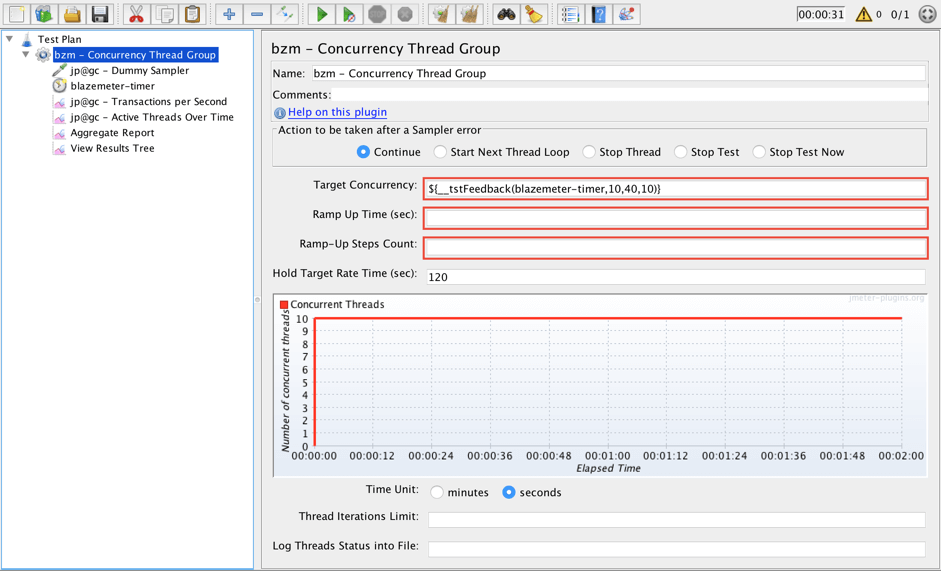
Update the following values:
- Target Concurrency: ${__tstFeedback(blazemeter-timer,10,40,10)}
- Ramp Up Time: blank
- Ramp-Up Steps Count: blank
__tstFeedback, the schedule feedback function, integrates the Concurrency Thread Group with ‘blazemeter-timer’ Throughput Shaping Timer. 10 is the number of threads at the start. 40 is the maximum allowed number of threads. 10 (the last parameter) is how many spare threads are kept during the test run. The last parameter is interpreted as an absolute count, if it is above 1. It is interpreted as a ratio relative to the current estimate of threads needed, if it is a float value less than 1. then the Ramp Up Time and Ramp-Up Steps Count should be blank.
10. Now it is time to start our test again.
The load schedule was achieved and looks correct according to the Throughput Shaping Timer. But let’s check the Active Threads Over Time listener and see how the Concurrency Thread Group graph is different.
Here we see a gradually rising number of threads. This means JMeter was able to start new threads to satisfy the necessary RPS load schedule. Also note that 26 virtual users are enough to achieve maximum RPS. According to the formula above this number was 28.
Great. We saw how to use the Throughput Shaping Timer element and the Feedback Function.
Back to top
Checking the Test Status
Component Properties
11. The Throughput Shaping Timer plugin also adds a number of properties to the standard JMeter functionality:
- elementName_totalDuration is a sum of all durations from the Request Per Second Schedule table;
- elementName_cntDelayed is the current count of delayed threads;
- elementName_cntSent is the number of samples sent since the beginning of the second. This value is changed dynamically throughout the test run.;
- elementName_rps is the current value of RPS load. This value is changed dynamically throughout the test run.
Those properties are accessible using the __P function or in JSR223 Test Elements via the following expression props.get("property_name").
Let’s try the __P function below for demo purposes.
Open a Dummy Sampler element.
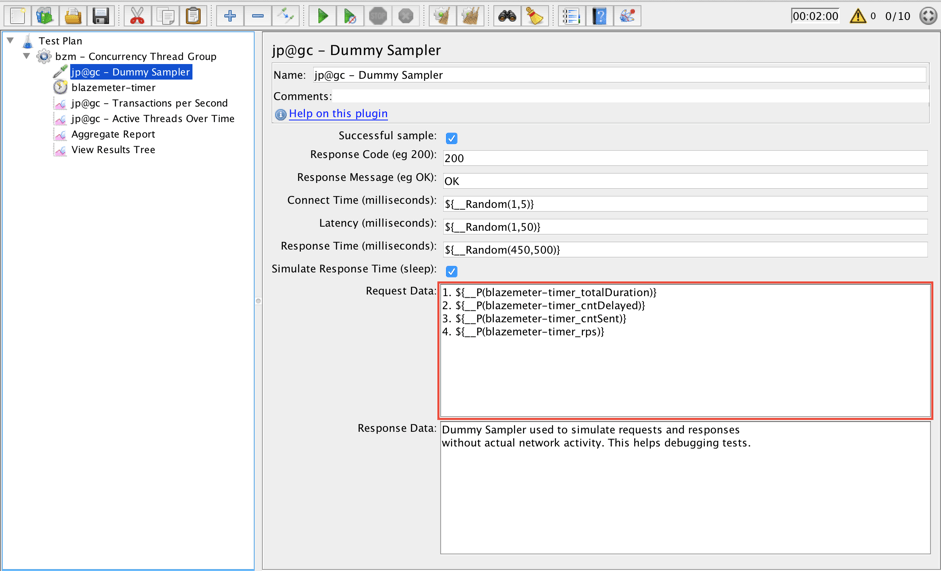
Fill in the following values to Request Data field:
- 1. ${__P(blazemeter-timer_totalDuration)}
- 2. ${__P(blazemeter-timer_cntDelayed)}
- 3. ${__P(blazemeter-timer_cntSent)}
- 4. ${__P(blazemeter-timer_rps)}
Each call of the Dummy Sampler will execute these functions and return the corresponding values. ‘Blazemeter-timer’ is the name of an appropriate Throughput Shaping Timer.
12. Run the script again to see how it works. Choose a random request in the View Results Tree listener and open the request tab.
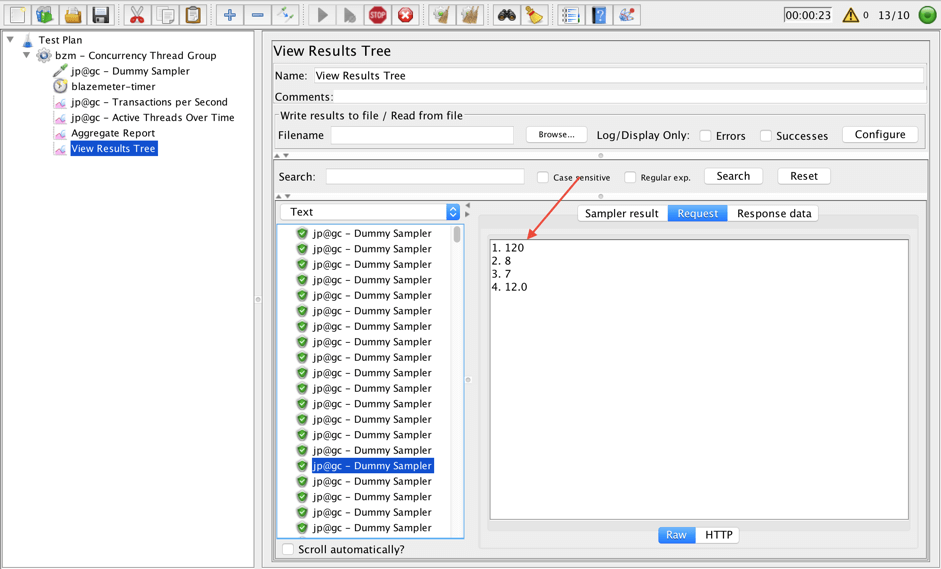
120 is the total duration in seconds for the whole test. 8 threads are delayed. 7 requests are executed since beginning of last second. 12 is the level of the RPS load.
You can use those properties for your needs in more advanced scripts!
Back to top
How to Specify a Load Pattern
Special Property Processing
13. Another feature is the “load_profile” property. This property specifies the load pattern with a set of function-like declarations. It can be used in the user.properties or jmeter.properties files, or via the command line.
The 3 available types of functions are:
- const(C, T) keeps constant load of C RPS for T seconds;
- line(C, N, T) does gradual increasing/decreasing of load from C to N RPS during T seconds;
- step(C, N, S, T) does stepping load from C to N RPS; each step height will be S RPS; each step duration will be T seconds.
‘2d2h13m5s’ is an example of a duration value, where s - seconds, m - minutes, h - hours and d - days.
So, now it is time to try this property from the command line. Go to the folder where your script is saved and run the following command from the command line.
jmeter -n -t blazemeter_script.jmx -l testresults.jtl -J"load_profile=const(50,60s) line(50,10,60s)"
Blazemeter_script.jmx is the name of the script. Testresults.jtl is the name of the file to save the results of the test. “load_profile=const(50,60s) line(50,10,60s)” is a load pattern which will mirror the pattern from our script. JMeter will save the results of the test to the testresults.jtl file after the script runs.
14. Find and open the test results file via a listener in your script to see how the test went.
It looks like the test passed. The load schedule was changed as expected. Target RPS load was achieved. We are good :)
Nice, we are done! In this blog post we took a look at the Throughput Shaping Timer. This plugin is a very convenient way to test throughput of a system. This plugin is number 5 in the Top Ten JMeter plugins list. Check the list to find more popular plugins!
Back to top
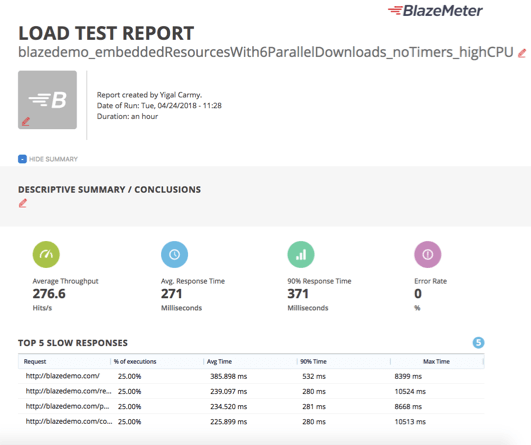
Sharing Your JMeter Load Test Results in BlazeMeter
What happens if you want to share your test results with members of your team and with managers? If you run your JMeter load test in BlazeMeter, you can get advanced analytics in real time:
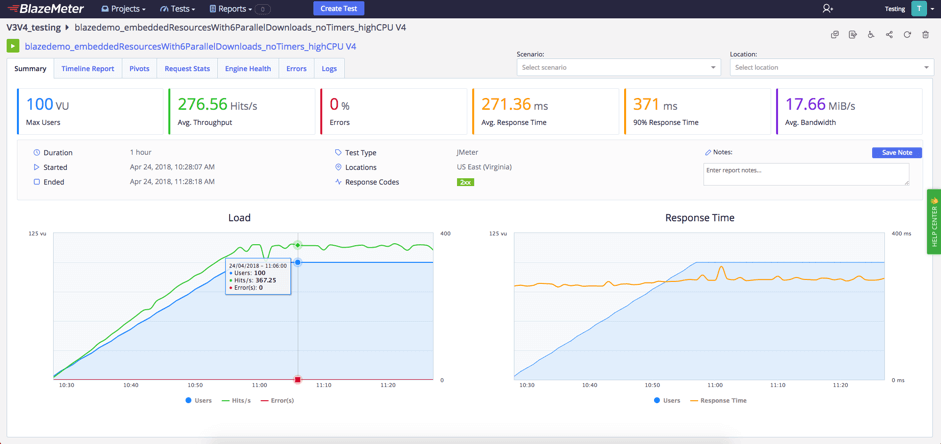
or from months back:
which also let you drill down and analyze KPIs for specific geo-locations, test sections, labels and more.
Because BlazeMeter is a SaaS product, you can share your test results via a URL with team members so they can work with you on analyzing the test results and also on adjusting the test parameters if you need. Managers can also see these results, or you can send them an executive summary that BlazeMeter automatically creates for them: