Blog
July 19, 2021
9 Easy Solutions for a JMeter Load Test “Out of Memory” Failure

Open Source Automation
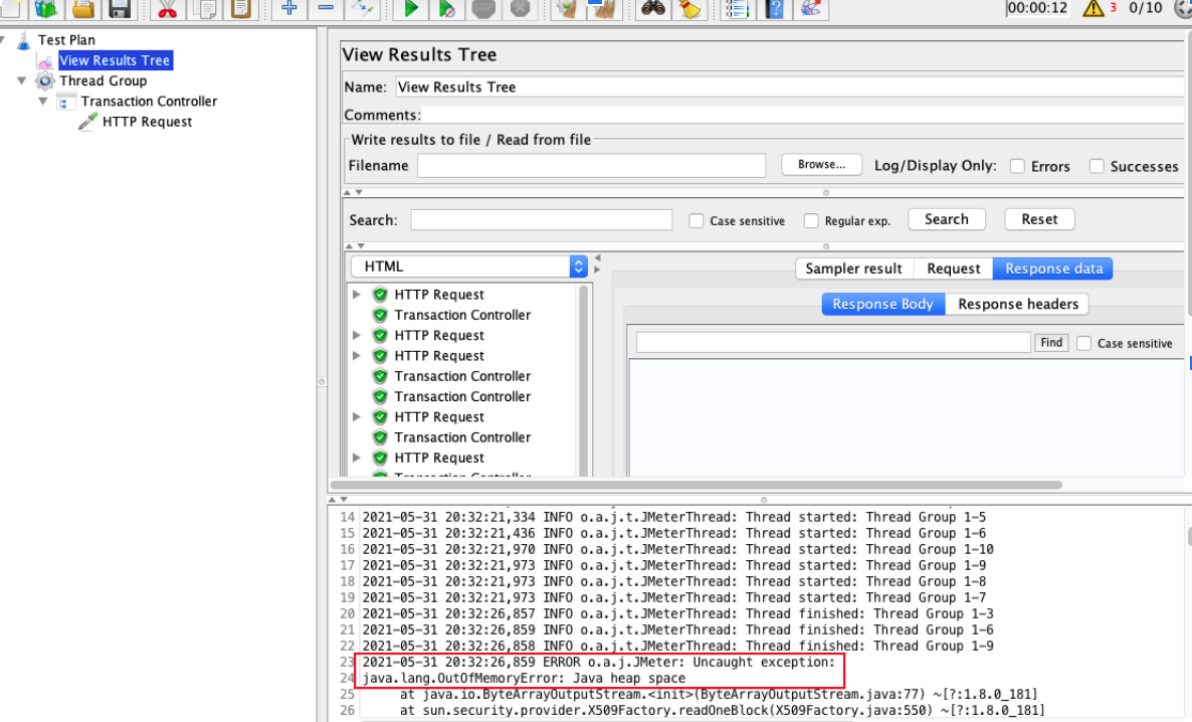
First thing's first: How many times have you seen this error on your JMeter load test?
Test failed! java.lang.OutOfMemoryError: Java heap space
Back to top
How do I allocate more memory to JMeter?
If you have received this out of memory error, there are easy ways to get around it. In this article, I'll show you nine ways to get the maximum load on your JMeter test without changing your current hardware setup including increasing the Java heap size, strategically using listeners, and much more.
🚀 Try BlazeMeter today for performance testing at scale >>
1. Increase the Java Heap Size
The JMeter process runs in the Java Virtual Machine (JVM) under various settings and arguments. The Java Heap Space (as referred to in the error message) is the memory the JVM takes from the underlying operating system to allocate space for the creation of necessary objects.
JMeter’s default configuration (see jmeter.bat for Windows or jmeter for non-Windows systems scripts) assumes a heap space of 1024 megabytes only. This is actually pretty low considering many modern smartphones have up to four times more! If your test is running massive objects which go over 1024Mb, you’ll get an OOM error and your test will fail.
Fortunately, there’s a simple solution. Just increase the maximum heap size to ~80% of your total available physical RAM. To do this, find the following line in your JMeter startup script:
HEAP=-Xms1g -Xmx1g
Now change the -Xmx value accordingly. For example: if you want to set the maximum heap size to 4 gigabytes, you’ll need to change the line to: HEAP="-Xms1g -Xmx4gm"
To apply the change, you’ll need to restart JMeter.
2. Use Up-to-Date Software
Your test might fail if your software is out of date. Make sure you’re using the most recent versions of the following:
- Java - use the latest 64-bit version of Java SE JDK or Server JRE where possible
- JMeter - it’s always best to use the latest version of JMeter as the new releases contain performance improvements and bug fixes in addition to any new features.
- JMeter Plugins (or other 3rd-party libraries) - for the same reasons as Java and JMeter
3. Run Tests in Non-GUI Mode
NEVER run a load test on the JMeter GUI! Use it only for test recording, development, and debugging. JMeter is simply not designed to produce high loads in GUI mode, which means that it will not only freeze - but it will also consume loads of resources and produce unreliable load test results.
I recommend running load tests in the command-line mode, Ant tasks, or Maven plugins - but never the GUI.
If you want more information on the available options, check out Five Ways To Launch a JMeter Test without Using the JMeter GUI.
4. Use Listeners Wisely
Disable ALL Listeners During the Test Run
Listeners should be disabled during load tests. Enabling them causes additional overheads, which consume valuable resources that are needed by more important elements of your test.
You can open the .jtl results file with any listener you want after the test completes and perform its analysis.
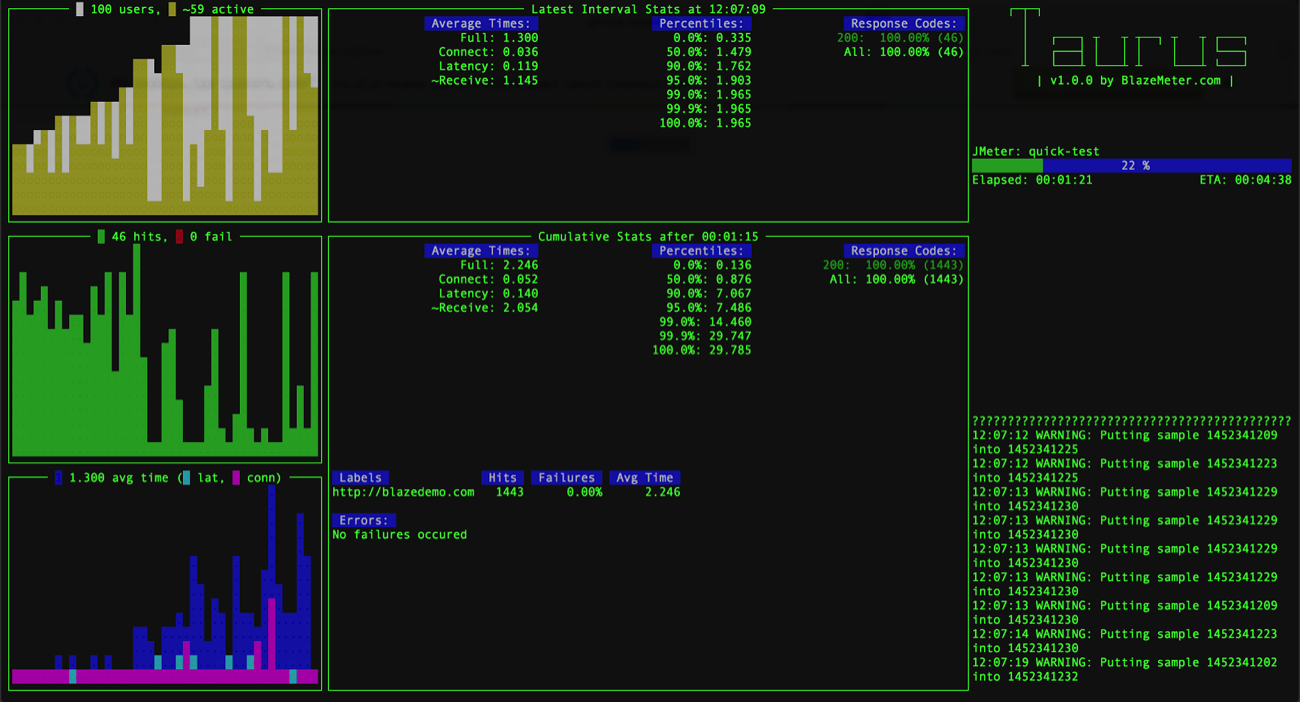
If you want to view metrics during the test execution, try running your JMeter test via the Taurus framework. This means you’ll be able to view report statistics via your console and or web interface.
5. Decide Which Metrics You Need to Store
Configure JMeter to ensure that it will only save the metrics that you absolutely need. You can control what to store by adding relevant lines to the user.properties file (you can find this in the /bin folder of your JMeter installation).
For example: with listeners like the Active Threads Over Time Listener or Response Times vs Threads, you’ll need to store the number of currently active threads (as it isn’t done by default). To enable this, you’ll need to add the line “jmeter.save.saveservice.thread_counts=true” to the user.properties file.
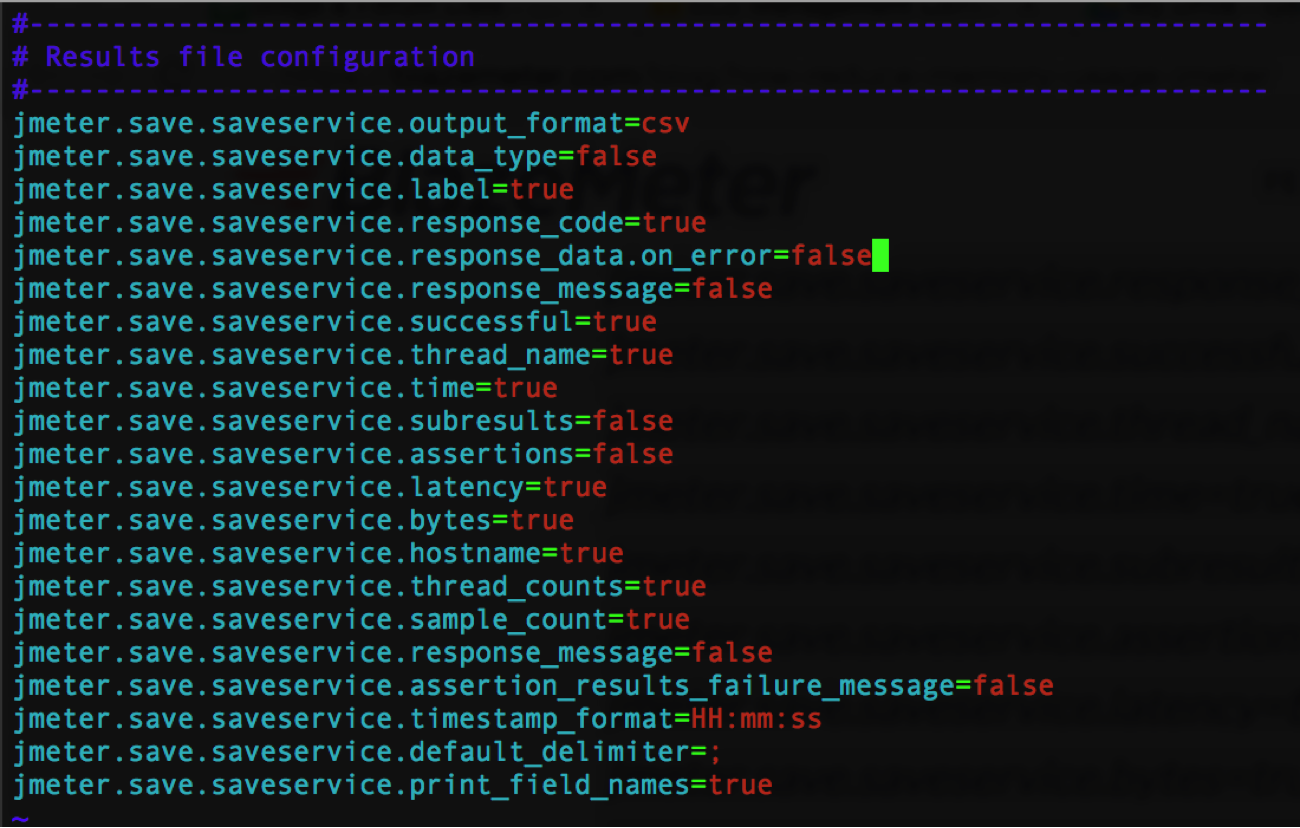
Similarly, to control the way results are saved, search for the Results File Configuration section of the jmeter.properties file (you’ll also find this in the JMeter /bin folder) and inspect the names and default values of properties that have names starting with: “jmeter.save.saveservice”. After figuring out the appropriate configuration, you can amend the user.properties file by specifying which metrics you need to store and which you don’t require.
Don’t forget that when it comes to storing requests and response headers, assertion results and response data can consume a lot of memory! So try not to store these values on JMeter unless it’s absolutely necessary.
Check out 2 Awesome Tips for Reducing Memory Usage in JMeter for more information.
6. Select the Correct Correlation Option
If you need to extract something from the previous response, try using the Regular Expression Extractor.
If for some reason it’s not possible (i.e. you need to get multiple values from HTML using multiline complicated regex) try one of the following:
If the page has a very complex DOM but the number of styles is relatively low - go for the CSS/JQuery Extractor
If the number of styles is high and DOM is fairly simple - use the XPath Extractor
If you have enough time you can experiment and take memory footprints for each of the PostProcessors. This will clearly show you which one is better. But remember - this approach will have to be applied to every single page as different applications have different responses.
7. Use Assertions Sparingly
Every test element added to the test plan will be processed - and this takes CPU time and memory. This also applies to all your Assertions, and is especially true for Compare Assertions - which consumes a lot of resources and memory. Only use the assertions you need and, even then, just use the amount that are absolutely required.
8. Check Your Scripting Language
JMeter supports quite a lot of scripting languages. However, if you’re using a scripting-based sampler to create the actual load, you’ll need to use the JSR223 Sampler and “Groovy” as a language.
The Groovy scripting engine implements the Compilable interface. So if your script is well designed, you’ll get a performance comparable with pure Java code. If you want more detailed explanations and scripting best practices, check out the guide: Beanshell vs JSR223 vs Java JMeter Scripting: The Performance-Off You've Been Waiting For!
If you need to do something very simple (i.e. converting a variable to a property, setting the While Controller condition, getting the current iteration number etc.), you can use the JavaScript or Beanshell engines as they’re available out of the box and JavaScript is used under the If Controller’s hood. However, when you start creating the load via the scripting test element, go for JSR223 and Groovy.
9. “Tweak” Your JVM
You can also add or modify the following JVM arguments in your JMeter startup scripts:
locate the NEW="-XX:NewSize=128m -XX:MaxNewSize=128m" line in the JMeter startup script. Uncomment it and increase the values to match the ones you set for HEAP
-server - this switches JVM into “server” mode with runtime parameters optimization. In this mode JMeter starts more slowly, but your overall throughput will be higher
-d64 - if you have a 64-bit OS, use this parameter to explicitly tell JVM to run in 64-bit mode
-XX:+UseConcMarkSweepGC - this forces the usage of the CMS garbage collector. It will lower the overall throughput but leads to much shorter CPU intensive garbage collections.
-XX:+DisableExplicitGC - this prevents applications from forcing expensive garbage collections and helps avoid unexpected pauses. In general, garbage collection tuning is a very big topic. If you think that JMeter’s throughput could be better and it doesn’t fully utilize JVM, OS and machine resources, try using JConsole or VisualVM to monitor the JMeter process and inspect the heap size usage, GC interval, the time the system spends in garbage collection etc. Ideally, the GC should look like a “pulse” of a healthy human being. The garbage collector should fire often enough to prevent OOM - but not so much that its impact is strongly felt.
Back to top
Still Not Working?
If you’ve tried all of the above points, but your machine still can’t produce the load you require, you have two options:
Employ distributed testing by adding more hosts and configuring them manually. JMeter supports the distributed mode when one master machine orchestrates several slaves, meaning the load comes from several generators. Remember that the master machine doesn’t generate any load, so you’ll need three hosts to increase throughput by a factor of two.
Run a JMeter test in the BlazeMeter cloud. This is very simple to set up and gives a lot of valuable features, such as: advanced results analysis, the ability to compare different test runs, and integrations with automation and monitoring tools.
Want to Learn More About JMeter & Load Testing?
Check out BlazeMeter University!
This blog post was updated in July 2021 for accuracy.